
Writing the papers (planned)
This chapter covers
- Three reports the project can produce, and what each needs before it can be written
- The claims each report may make, and the evidence each claim requires
- Data provenance, terms of use and privacy
- A reproducibility checklist and the structure of each report
Status: plan only. No report has been written.
8.1 Scope
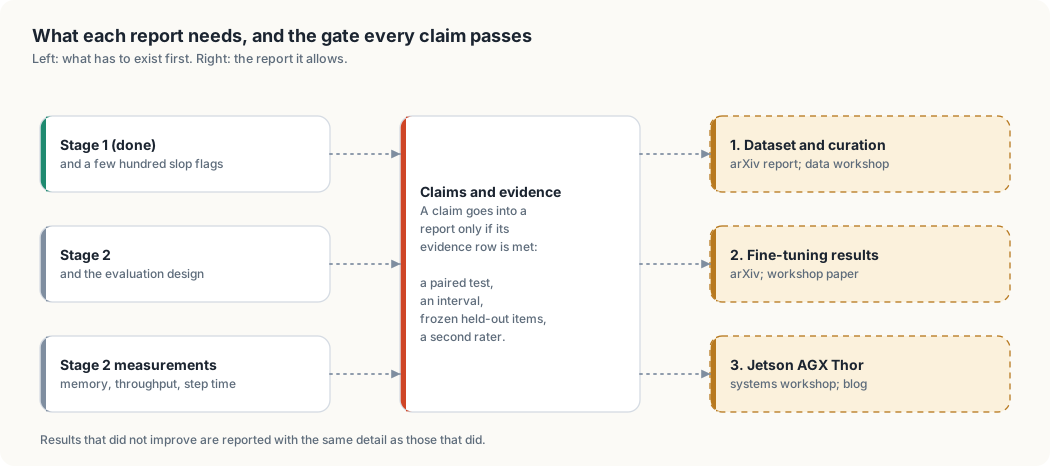
The project has one author, one main reviewer, one machine and evaluation sets of about 100 items per category. That supports technical reports and workshop papers. A main-conference paper would need several raters, larger held-out sets and stronger baselines. The reports below are sized to the evidence the project can collect.
| Report | Question | Needs first | Venue |
|---|---|---|---|
| 1. Dataset and curation | How was a personal corpus turned into training data, and what did human slop labelling add? | Stage 1 (done), a few hundred slop flags | arXiv technical report; data-centric ML workshop |
| 2. Fine-tuning results | Does QLoRA on this data improve rule compliance, honesty and slop density without losing general ability or safety? | Stage 2, chapter 10 evaluation | arXiv; workshop paper |
| 3. Training and serving on Jetson AGX Thor | What memory, throughput and step time does QLoRA training and TensorRT-LLM serving reach on sm_110 unified memory? | Stage 2 measurements | systems or efficient-ML workshop; engineering blog |
Report 1 can be written first: its material exists now.
8.2 Claims and evidence
A claim may appear in a report only if its evidence row is met.
| Claim | Evidence required |
|---|---|
| “Fine-tuning improved X” | paired test significant at 0.05 and the effect interval excludes 0, on frozen held-out items with \(O(e) = 0\) |
| “Fine-tuning did not hurt Y” | the interval of the difference lies within a margin stated before the run (for example 3 points) |
| “Readers preferred the fine-tuned model” | win rate interval above 0.5 and second-rater \(\kappa \geq 0.6\) |
| “The model is safer / no less safe” | \(S_h\) and \(S_o\) intervals compared with the base model; \(L = 0\) |
| “Training on Thor reaches N tokens/s” | median and interquartile range over a stated workload, with the manifest |
| “Human slop labels improve the data” | the same training run with and without flagged examples, compared on \(D\) and \(W\) |
Results that did not improve are reported with the same detail as those that did.
8.3 Provenance, terms and privacy
| Issue | Consequence |
|---|---|
| Most training text is synthetic output from open-source models | Each model carries its own license and terms. Check the license of every model in the one to twenty billion parameter range before publishing a model, a dataset or results based on it. |
| The data contains personal information (chapter 3) | The raw dataset is not published. A report publishes the method, statistics, the evaluation set and per-item scores. |
| Book sections are the author’s own work | May be published by the author; the license of the book repository applies. |
| Public benchmarks | Cite source and version; follow each benchmark’s license. |
8.4 Reproducibility checklist
Before a report is submitted, every item is true:
- git commit of the code for every run is stated
-
runs/<run_id>/for every cited number is committed: manifest, answers, scores, summary -
eval/held_out.jsonlhash matches the manifests -
overlap_report.mdshows no unresolved overlap - hardware, JetPack, CUDA, TensorRT-LLM and driver versions are listed
- training hyperparameters, seeds and data mix (including readability repetition) are listed
- every rate has \(n\) and a 95% interval
- negative and null results are included
- limitations section names: one author, one main rater, corpus size, synthetic data from open-source models
8.5 Report structure
All three reports use the same outline, written to the standard of WRITING_GUIDE.md and anti_ai_slop.md.
| Section | Content |
|---|---|
| Abstract | question, method, main numbers with intervals, one sentence on limits |
| 1. Introduction | the problem and the contribution, in that order |
| 2. Related work | prior work the report builds on or differs from |
| 3. Data or setup | sources, filtering, hardware, settings |
| 4. Method | what was done, precisely enough to repeat |
| 5. Results | tables with intervals; figures where a table is harder to read |
| 6. Analysis | where the effect comes from; failure cases with examples |
| 7. Limitations | what the results do not show |
| 8. Ethics and data | provenance, terms, privacy |
| Appendix | prompts, full per-category tables, manifests |
Report 1: dataset and curation
Contributions:
- the pipeline of chapters 2 and 3
- the two-level slop labelling done on the review page, with its category taxonomy
- statistics of the corpus and of the human labels: spans per category, examples flagged per source
- agreement between two labellers on a shared sample
Report 2: fine-tuning results
Contributions:
- base, prompted-base and fine-tuned models compared on every metric of chapter “Evaluation design”
- the effect of SFT alone and SFT plus DPO on the clever-vs-readable pairs
- ablations: without the readability repetition, and without removing the human-flagged examples
Report 3: Jetson AGX Thor
Contributions:
- measured peak memory and step time for QLoRA at several model sizes and sequence lengths
- serving throughput for each supported quantization mode on sm_110
- the software versions and workarounds needed, including the CUDA 12 library requirement in
CLAUDE.md - serving capacity for many users at once: the model and benchmark below
Serving capacity: model to test
Decoding is limited by memory bandwidth (273 GB/s on the Thor), not compute: each step reads the weights it uses once, and that read serves every reply in the batch. Like hardware threads sharing a core, more slots add throughput until the shared resource, bandwidth, is used up.
| Replies at once | Read per step (estimate) | Per reply (estimate) | Total (estimate) |
|---|---|---|---|
| 1 | ~3.7 GB, the ~3.5B active parameters at Q8 | ≤ 74 tok/s; 53 measured | 53 tok/s measured |
| 16 | ~20 GB, as the batch touches more experts | ~14 tok/s | ~220 tok/s |
| 64 or more | ≤ 33.6 GB, the whole model | ~8 tok/s | ~500 tok/s |
Compute is not the limit: a token costs about 2 × 3.5B ≈ 7 GFLOP. Memory limits the batch: context costs about 6 GB per million tokens (measured: 4 × 1M tokens took about 24 GB beside 34 GB of weights), so about 70 GB holds about 11M tokens, e.g. 44 slots of 256K.
From throughput to users, assuming a comfortable 15 tok/s per reply and that a chatting person is generating about 15% of the time: about 16 replies at once, so about 100 people online at once, about 800K tokens or 1,600 replies of 500 tokens per hour.
Unknowns the benchmark settles: how many experts a batch touches in practice, and how efficiency falls at large batches.
Serving capacity: benchmark
| Setting | Values |
|---|---|
| Model | Nemotron 3 Nano 30B-A3B Q8_0, llama-server |
| Slots × context | 16 × 256K, 32 × 128K |
| Concurrent requests | 1, 2, 4, 8, 16, 32 |
| Prompt | the same 500-token prompt, 500-token reply, thinking off |
| Record per run | per-reply tok/s (median and slowest), total tok/s, first-token time, GPU memory, power |
Result: a curve of per-reply and total tok/s against concurrent replies, and the concurrency where per-reply speed falls below 15 tok/s.