Chapter 25: Profiling, Debugging & Performance Engineering
Every performance claim in the earlier chapters rested on a measurement. We timed kernels with CUDA events, counted wrong elements, and compared results with a reference computed on the CPU. Recall that a CUDA event is a marker that a program places in a stream of GPU work; the GPU writes the time at which it reaches the marker, so the difference between 2 events is the time of the work issued between them. Each of these measurements answers a single question about a single run. When a program is slower than expected, or produces a wrong answer only some of the time, we need tools that tell us more: a record of what the GPU did and when, the counts that the hardware keeps for each kernel, a checker that inspects every memory access, and a clock that a thread can read from inside a kernel.
In this chapter, we introduce these tools and apply each of them to a program from an earlier chapter: the stream pipeline of Chapter 6, the matrix multiplication of Chapter 9, the vector addition of Chapter 3 and the block sum of Chapter 5. We use an in-kernel clock to measure the latencies that we assumed in Chapter 1, about 4 cycles for an arithmetic operation and several hundred cycles for a read from memory. A cycle is 1 period of the clock that drives the GPU’s processors: at a clock rate of 1 GHz, a cycle lasts 1 ns. We then turn to the question of whether a measurement or a test result can be trusted, and we close with the procedure that connects all of these tools: measure, explain, change one thing, and measure again.
This chapter covers
- profilers, traces and hardware performance counters
- reading an Nsight Systems timeline and accounting for its run time
- the sections of an Nsight Compute report, and a speed-of-light analysis done by hand
- finding out-of-bounds accesses, races, barrier errors and uninitialized reads with Compute Sanitizer
- stopping a single GPU thread with
cuda-gdb - measuring latencies in cycles with
clock64(), in C++ and in Rust - warm-up, medians and a protocol for timing kernels
- units in the last place, tolerances for sums, and known-answer tests
- a systematic process for performance work
The code of the chapter is in
code/ch16_profiling/
for C++ and in
code/oxide/ch16_latency/
for Rust. The measurements in this chapter come from 2 integrated GPUs: a Jetson Orin NX (8 SMs,
102 GB/s), the first GPU below, and a Jetson AGX Thor (20 SMs, 273 GB/s), the second. An
integrated GPU is built on the same chip as the CPU and uses the same memory. An SM, or
streaming multiprocessor, is one of the processors of the GPU, and the rate in GB/s is the peak
rate at which the GPU can move data to and from its memory.
25.1 Tools for performance and correctness
25.1.1 Profilers, traces and counters
Consider a program that copies an array to the GPU, runs 1 kernel on it, and copies the result back, and suppose that the whole run takes 20 ms. A clock read before and after the run tells us only the 20 ms. To make the program faster, we need 2 further pieces of information. The first is how the 20 ms divide among the 3 steps. If the 2 copies take 15 ms and the kernel 5 ms, no change to the kernel can save more than 5 ms. The second, once we know that the kernel matters, is what the kernel did during its time: whether it was reading memory, computing, or waiting. A profiler is a program that records what another program does while it runs, and on a GPU the 2 questions are answered by two kinds of record.
Definition 25.1 Trace and hardware performance counter. A trace is a list of timestamped events, each with a start time and an end time. A hardware performance counter is a register inside the GPU that counts events of one kind while a kernel runs.
Example. The trace of section 25.2 records a copy that started at 0.665 ms and ended at 1.470 ms, and a kernel that ran from 1.978 ms to 3.311 ms. A counter of bytes read from DRAM would read 268,435,456 after a kernel that reads 256 MiB once.
Here DRAM is the GPU’s main memory, the large memory outside the processors; on an integrated GPU it is the same memory that the CPU uses. Recall that a warp is a group of 32 threads that execute each instruction together. Besides bytes read from DRAM, counters record quantities such as the number of instructions issued and the number of cycles in which a warp could not proceed. A trace tells us where the time of a whole program went. Counters tell us why a particular kernel took the time it did.
NVIDIA provides 1 profiler for each kind of record. Nsight Systems, run as nsys, traces the
whole program: the CUDA calls made by the CPU and the copies and kernels executed by the GPU, all
on a common time axis. Nsight Compute, run as ncu, reads the counters of 1 kernel at a time.
A GPU has fewer counter registers than there are kinds of events to count. For example, if a GPU
had 4 counter registers and we asked for 12 kinds of events, the 12 could not be counted in 1
run; they would need 3 runs of 4 kinds each. Therefore, ncu runs the same kernel several times,
counts a different set of events in each run, and restores the kernel’s memory before each run,
so that every run starts from the same data. This repetition is called replay. Replay makes
ncu slow, and it is the reason why the kernel times reported by ncu differ from those of an
ordinary run.
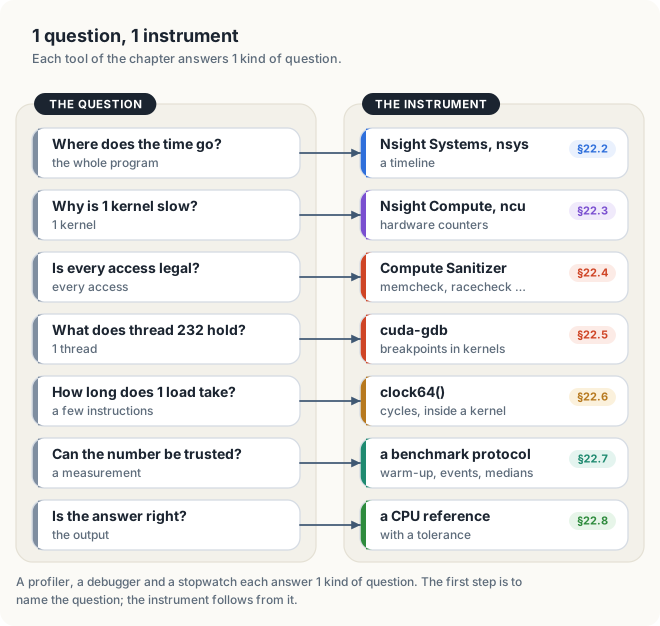
Profilers do not check whether a program is correct. For correctness, the CUDA toolkit provides 2 other tools. Compute Sanitizer adds checks to every memory access of a kernel while it runs, and to every barrier, a point in a kernel at which the threads of a block wait for each other. cuda-gdb is a debugger: a program that controls another program, stops it at chosen points called breakpoints, and shows its state. cuda-gdb can stop a kernel at a source line and show the variables of any one of its threads. Figure 25.1 pairs each question that we ask in this chapter with the tool that answers it.
25.1.2 Which tool to use first
The order in which we apply these tools follows from Amdahl’s law (Chapter 1, section 1.3). Amdahl’s law states that if a fraction \(p\) of a run is made \(s\) times faster, the run takes \((1 - p) + p / s\) of its original time. Making a kernel faster can only shorten the part of the run during which that kernel executes. Take the run of 20 ms of section 25.1.1, in which the copies take 15 ms and the kernel 5 ms, so \(p\) = 5 / 20 = 0.25. A kernel twice as fast, \(s = 2\), gives a run of 15 + 5 / 2 = 17.5 ms. A kernel 10 times as fast gives 15 + 0.5 = 15.5 ms, and even an infinitely fast kernel leaves the 15 ms of copies.
Key observation A change to 1 part of a run can save at most the time that part takes. Before we speed up any part, we must know how long each part takes.
The pipeline of Chapter 6, a program that copies data in, processes it with a kernel and copies it out, shows the same effect on measured times. Its 1-stream version, which we trace in section 25.2, takes 20.95 ms: 6.18 ms of copy in, 10.40 ms of kernel and 4.19 ms of copy out, executed one after another. If we made the kernel twice as fast, it would take 10.40 / 2 = 5.20 ms, and the run would take 20.95 − 5.20 = 15.75 ms. Overlapping the copies with the kernel instead, using 2 streams and 8 chunks, brought the run down to 13.59 ms without changing the kernel at all.
The timeline showed where the time went before any kernel was tuned, and it pointed to the larger gain. For this reason, we start with Nsight Systems, and we turn to Nsight Compute only once the timeline shows that a kernel dominates the run.
25.1.3 Access permissions for counters and debuggers
Hardware counters and debugger control are restricted on most systems. In 2018, researchers showed that a program could learn about the work of another program from the GPU’s performance counters. An attack of this kind, in which 1 program infers another program’s data from a shared resource instead of reading the data itself, is called a side channel. The vulnerability was registered as CVE-2018-6260; a CVE number is the identifier under which a published security vulnerability is listed. Since then, NVIDIA’s drivers have allowed only administrators to read the counters, unless the owner of the machine changes a driver option. Debugging is restricted for a similar reason: a debugger can read any memory of the program it controls. The table below lists what each tool needs.
| Tool | Needs |
|---|---|
nsys (trace) | no special rights |
ncu (counters) | counter access: an administrator, or the driver option below |
compute-sanitizer | debugger access |
cuda-gdb | debugger access |
On a machine that we administer, sudo ncu ... reads the counters. A desktop Linux system can
allow every user to read them with the driver option NVreg_RestrictProfilingToAdminUsers=0, set
in a file under /etc/modprobe.d/; NVIDIA’s page for ERR_NVGPUCTRPERM gives the steps for each
operating system. Here sudo runs 1 command with administrator rights, and a driver option
is a setting that the GPU driver reads when the operating system loads it. On Jetson modules,
counter and debugger access go through 2 device files, special files under /dev through
which a program talks to a driver: /dev/nvhost-prof-gpu and /dev/nvhost-dbg-gpu. Like any
file, a device file has an owner and a group, a named set of users who share its permissions.
Both files belong to the group debug, so the tools must be run with sudo or by a member of
that group.
25.2 Timelines with Nsight Systems
25.2.1 Recording a trace
Recall from Chapter 6 that a stream is a queue of GPU work whose operations run in the order in
which they were issued, and that work in different streams may overlap. Chapter 6’s program
streams performs the same work in three ways: copy in, kernel and copy out on 1 stream; the same in 8
chunks on 2 streams; and the same in 32 chunks. A chunk is 1 of the equal pieces into which
the data is split, so that the copy of 1 chunk can run while the kernel works on another. We can
trace the program without changing a line of code:
$ nsys profile -t cuda -o streams ./streams
$ nsys stats --report cuda_gpu_kern_sum,cuda_gpu_mem_time_sum streams.nsys-rep
The option -t cuda records CUDA calls, copies and kernels, and -o names the report file. The
command nsys stats prints summaries of the report as tables. The first summary lists every
kernel (the columns Min, Max and StdDev are omitted here):
 Time (%)  Total Time (ns)  Instances   Avg (ns)    Med (ns)   Name
     99.5      297,936,832        248  1,201,358.2  336,896.0  work(float *, int, int)
      0.5        1,368,576      1,001      1,367.2    1,376.0  empty()
A summary is useful only if we can account for its numbers. Before it measures, the program
warms up: it runs the work a few times without timing it, for reasons that we explain in
section 25.7.1. It launches work 40 times while it warms up, in 5 runs of 8 chunks. It launches the kernel twice to time a single launch, and
once to time the 3 stages separately. Then come 5 runs of 1 chunk, 5 runs of 8 chunks and 5 runs of
32 chunks. In total, this gives 40 + 2 + 1 + 5 + 40 + 160 = 248 launches, which is the number in the
table. The median time, 0.34 ms, is that of the kernel on 1 chunk of 32, because 160 of the 248
launches are of that size.
25.2.2 Accounting for the run time
The report also holds the start and end time of every copy and kernel. Figure 25.2 draws 2 repetitions from it on a common scale: the last run of the 1-stream pipeline and the first run of the 2-stream pipeline with 8 chunks.
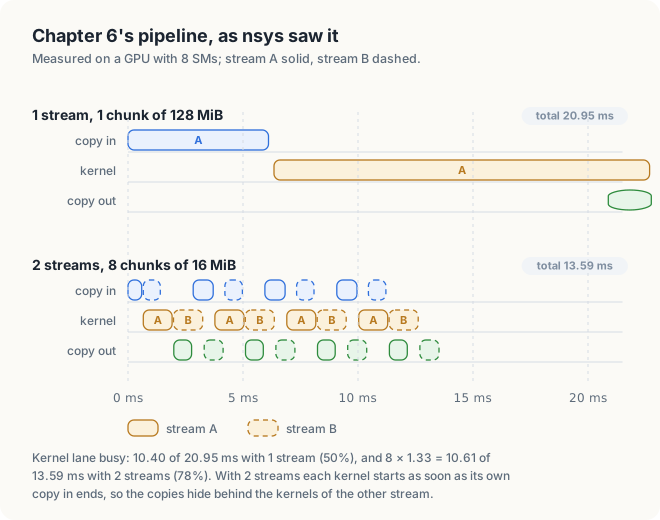
We say that a lane of the timeline is busy while it executes an operation. The fraction of the run during which the kernel lane is busy measures how well the pipeline keeps the arithmetic units supplied with work. With 1 stream, the kernel lane is busy for 10.40 ms of 20.95 ms, or 50% of the run. With 2 streams, the 8 kernels take 1.32 to 1.33 ms each, 10.61 ms in total, out of 13.59 ms, or 78% of the run.
We can go further and account for every millisecond of the 2-stream run. To see how, let us first work a smaller case by hand. Suppose that the data is split into 2 chunks, and that for each chunk the copy in takes 1 ms, the kernel 2 ms and the copy out 1 ms. On 1 stream, the 6 operations run one after another, and the run takes 2 × (1 + 2 + 1) = 8 ms. On 2 streams, chunk 0 goes to stream A and chunk 1 to stream B, and operations of different streams may overlap:
| Time (ms) | Copy-in lane | Kernel lane | Copy-out lane |
|---|---|---|---|
| 0 to 1 | chunk 0 | idle | idle |
| 1 to 2 | chunk 1 | chunk 0 | idle |
| 2 to 3 | idle | chunk 0 | idle |
| 3 to 4 | idle | chunk 1 | chunk 0 |
| 4 to 5 | idle | chunk 1 | idle |
| 5 to 6 | idle | idle | chunk 1 |
The run takes 6 ms. The kernel lane is busy for 4 of the 6 ms, and the two kernels run back to back, from 1 ms to 5 ms. The run is therefore made of three parts: the first copy in, 1 ms; the kernels, 2 + 2 = 4 ms; and the last copy out, 1 ms. The copies of the other chunk are hidden behind the kernels.
Key observation When the kernels of a pipeline run back to back, the run lasts as long as the first copy in, plus all the kernels, plus the last copy out. Any further time is a gap in the kernel lane, and each gap has a cause that the trace can show.
The 2-stream run of Figure 25.2 can be accounted for in the same way.
Worked example: accounting for the 2-stream run
- The run cannot be shorter than the first copy in, 0.66 ms, followed by the 8 kernels back to back, 10.61 ms, followed by the last copy out, 0.90 ms: 12.17 ms in total.
- The trace shows 3 gaps in the kernel lane, before kernels 3, 5 and 7, of 0.47 ms, 0.48 ms and 0.48 ms: 1.42 ms in total.
- 12.17 ms + 1.42 ms = 13.59 ms, which is the measured run.
The 3 gaps have a single cause. A stream executes its operations in the order in which they were issued. The chunks alternate between the streams, so stream A receives chunks 0, 2, 4 and 6, and its queue holds copy in 0, kernel 0, copy out 0, copy in 2, kernel 2, copy out 2, and so on. Stream A therefore holds the copy out of chunk 0 before the copy in of chunk 2, so chunk 2 cannot start copying until the result of chunk 0 has left the GPU, at 2.83 ms. Its copy then takes 0.94 ms, and kernel 3 starts at 3.78 ms, although the kernel lane has been idle since 3.31 ms. Exercise 2 asks the reader to remove these gaps.
Tracing a program can change its timing, because the profiler does work of its own to record each event. The program also times the same pipeline itself, without the profiler, and printed 13.08 ms, 13.31 ms and 13.34 ms in 3 runs. The traced run, 13.59 ms, is within 4% of those times, so the trace describes the program as it normally runs.
25.2.3 Common timeline patterns
Most performance problems of a GPU program are visible on a timeline. The table below lists the common patterns, their likely causes, and the chapters in which we treat them. Four terms in it come from earlier chapters. Pageable memory is ordinary host memory, which the operating system may move, and pinned memory is host memory locked in place, so that the GPU can copy it directly (Chapter 4). The launch cost is the CPU time that 1 kernel launch takes before it returns. A CUDA graph records a sequence of launches once and then issues the whole sequence with 1 call.
| What the timeline shows | Likely cause | Remedy |
|---|---|---|
| kernel lane idle while a copy runs, and the reverse | 1 stream, or copies from pageable memory | streams and pinned memory (Chapters 4 and 6) |
| short gaps between many tiny kernels | the CPU’s launch cost, a few µs per launch | CUDA graphs (section 6.7) |
long CPU calls such as cudaMalloc between kernels | allocation inside the loop | allocate once, before the loop |
| kernel lane busy nearly all the time | the kernels themselves | Nsight Compute (section 25.3) |
25.2.4 Tracing a Rust program
nsys traces any program that uses the CUDA driver, regardless of the language in which it was
written. For the Rust program of section 25.6, it prints the Rust names of the kernels:
$ nsys profile -t cuda -o rust ./target/release/ch16_latency
$ nsys stats --report cuda_gpu_kern_sum rust.nsys-rep
 Time (%)  Total Time (ns)  Instances   Avg (ns)     Med (ns)     Name
     99.5       19,164,896          3  6,388,298.7  8,258,176.0  chase
      0.3           63,680          1     63,680.0     63,680.0  dependent_fma
      0.1           23,680          1     23,680.0     23,680.0  independent_fma
The summary of CPU calls shows cuLaunchKernel and cuModuleLoadData where the C++ program shows
cudaLaunchKernel. CUDA offers 2 sets of host functions. The runtime API is the set whose
names begin with cuda, such as cudaMalloc and cudaLaunchKernel. The driver API is a
lower-level set whose names begin with cu, such as cuLaunchKernel, and cuModuleLoadData
loads the compiled code of the kernels onto the GPU. cuda-oxide calls the driver API directly,
whereas the C++ programs call the runtime API, which in turn calls the driver (Chapter 12).
25.3 Kernel analysis with Nsight Compute
25.3.1 Sections of a kernel report
ncu organizes its counters into sections, named groups of related counters with the
quantities computed from them, and 3 of them answer most questions.
The speed of light of a hardware unit is its peak rate. The SpeedOfLight section reports how
close the kernel came to the peak rate of the arithmetic units and to that of the memory system, as
percentages. A kernel that comes close to 100% for one of these units is limited by that unit, as
the roofline model of Chapter 1 predicts. Recall that the roofline model bounds the rate of a
kernel by the smaller of two limits: the peak arithmetic rate, and the memory bandwidth multiplied by
the number of operations the kernel performs per byte it moves. In Section 25.3.3, we compute these
percentages by hand.
The Occupancy section reports how fully the kernel uses the SMs. Recall that an SM runs
blocks, groups of up to 1,024 threads that share its fast shared memory, and that it keeps
the warps of several blocks resident at once: their registers stay on the SM, so the SM can
switch from 1 warp to another in any cycle. When 1 warp waits for a load, the SM issues an
instruction of another warp. The more warps are resident, the more likely it is that some warp is
ready to issue.
Definition 25.2 Occupancy. The occupancy of a kernel is the number of warps resident on an SM divided by the maximum number of warps the SM can hold (Chapter 2, section 2.9).
Example. An SM of either GPU of this chapter holds at most 1,536 threads, which is 1,536 / 32 = 48 warps. A kernel of which 3 blocks of 256 threads fit on 1 SM keeps 3 × 8 = 24 warps resident, and its occupancy is 24 / 48 = 50%.
The theoretical occupancy follows from the kernel’s registers, its shared memory and its block size, because these determine how many blocks fit on 1 SM at once. The achieved occupancy is the average measured while the kernel ran. It is lower than the theoretical occupancy when blocks finish unevenly, so that for part of the run an SM holds fewer blocks than it could.
The WarpStateStats section reports stalls. A stall is a cycle in which a warp could not issue
its next instruction. Global memory is the memory in DRAM that every thread of a kernel can
reach. The section counts stalls by reason, such as waiting for a load from global memory
(long_scoreboard), waiting for shared memory (short_scoreboard), or waiting at a barrier
(barrier). The scoreboard is the table in which the SM tracks which registers still wait for
the result of an earlier instruction. Loads from global memory take hundreds of cycles and are
tracked on the long scoreboard; loads from shared memory, which are much faster, are tracked on
the short one.
For Chapter 9’s kernel with 4 × 4 patches, on a machine where counters are allowed, the command is
$ sudo ncu --section SpeedOfLight --section Occupancy -k regex:patches -c 1 ./sgemm
The option --section chooses the sections to collect, and adding --section WarpStateStats
adds the stall reasons. The option -k selects kernels by name; regex:patches selects every
kernel whose name contains the text patches. The option -c 1 profiles only the first launch
that matches. Without counter access, ncu stops before the kernel runs and names the
setting described in section 25.1.3:
==ERROR== ERR_NVGPUCTRPERM - The user does not have permission to access NVIDIA GPU
Performance Counters on the target device 0.
25.3.2 Peak rates from device attributes
Several numbers of the report can be computed without counters, from the limits that the GPU
reports and a kernel time measured with events. The CUDA runtime describes the GPU in a
cudaDeviceProp structure, with 1 field for each property, and cudaDeviceGetAttribute returns
single values. Listing 25.1 prints the limits that we use in the rest of the chapter, and the 2 peak
rates they imply.
Before we read the output, let us see how a peak rate follows from such limits, on a small GPU
that we invent for the purpose. FP32 is the 32-bit floating-point format, the type float. A
FLOP is 1 floating-point operation, and a multiply-add \(a \times b + c\), which the
hardware performs as 1 instruction, counts as 2 FLOP. Suppose that our GPU has 2 SMs, that each SM
has 4 FP32 units, and that each unit completes 1 multiply-add per cycle at a clock of 1 GHz. In
each cycle the GPU then completes 2 × 4 = 8 multiply-adds, or 16 FLOP, and in 1 s it completes 16
× 109 FLOP: its peak is 16 GFLOP/s. The memory side works the same way. The memory
bus is the set of wires between the GPU and DRAM, and its width is the number of bits that cross
it in 1 transfer. The memory of these GPUs makes 2 transfers per cycle of its own clock, the
memory clock. A bus of 64 bits carries 8 bytes per transfer, so at a memory clock of 1 GHz it
moves 2 × 8 bytes × 109 = 16 GB/s.
Listing 25.1 The limits of the GPU, and the peaks they imply. code/ch16_profiling/measure.cu
/// Asks the driver for 1 integer attribute of `device`.
fn attribute(device: CUdevice, which: CUdevice_attribute) -> Result<i32, DriverError> {
    let mut value = 0;

    // SAFETY: `value` is a valid place for 1 integer; `device` came from a live context.
    unsafe { cuDeviceGetAttribute(&mut value, which, device).result()? };
    Ok(value)
}

/// Print the limits the GPU reports, and the peaks they imply.
fn limits(ctx: &CudaContext) -> Result<(), DriverError> {
    let device = ctx.cu_device();
    let (major, minor) = ctx.compute_capability()?;
    let sms = ctx.multiprocessor_count()?;

    let sm_clock_khz = attribute(device, SM_CLOCK)?;
    let mem_clock_khz = attribute(device, MEM_CLOCK)?;
    let bus_bits = attribute(device, BUS_BITS)?;
    let shared_kib = attribute(device, SHM)? / 1024;
    let l2_kib = attribute(device, L2_BYTES)? / 1024;
    let registers = attribute(device, REGS)?;
    let max_threads = ctx.max_threads_per_multiprocessor()?;
    let name = ctx.device_name()?;

    println!("{name}, compute capability {major}.{minor}");
    println!("  SMs                       {sms:8}");
    println!("  threads per SM, at most   {max_threads:8}");
    println!("  registers per SM          {registers:8}");
    println!("  shared memory per SM      {shared_kib:8} KiB");
    println!("  L2 cache                  {l2_kib:8} KiB");
    println!("  SM clock                  {:8} MHz", sm_clock_khz / 1000);
    println!("  memory clock              {:8} MHz", mem_clock_khz / 1000);
    println!("  memory bus                {bus_bits:8} bits");

    // 128 FP32 units per SM from compute capability 8.6; 2 FLOP per multiply-add.
    let peak_gflops = sms as f64 * 128.0 * 2.0 * sm_clock_khz as f64 / 1e6;

    // 2 transfers per memory clock (double data rate) of bus_bits / 8 bytes each.
    let peak_gbs = 2.0 * mem_clock_khz as f64 * 1e3 * (bus_bits / 8) as f64 / 1e9;

    println!("  FP32 peak from the clock  {peak_gflops:8.0} GFLOP/s");
    println!("  bandwidth from the clock  {peak_gbs:8.1} GB/s");
    Ok(())
}
// Print the limits the GPU reports, and the peaks they imply.
void limits()
{
cudaDeviceProp p;
check(cudaGetDeviceProperties(&p, 0));
int smClockKHz = attribute(cudaDevAttrClockRate);
int memClockKHz = attribute(cudaDevAttrMemoryClockRate);
int busBits = attribute(cudaDevAttrGlobalMemoryBusWidth);
size_t sharedKiB = p.sharedMemPerMultiprocessor / 1024;
std::printf("%s, compute capability %d.%d\n", p.name, p.major, p.minor);
std::printf(" SMs %8d\n", p.multiProcessorCount);
std::printf(" threads per SM, at most %8d\n", p.maxThreadsPerMultiProcessor);
std::printf(" registers per SM %8d\n", p.regsPerMultiprocessor);
std::printf(" shared memory per SM %8zu KiB\n", sharedKiB);
std::printf(" L2 cache %8d KiB\n", p.l2CacheSize / 1024);
std::printf(" SM clock %8d MHz\n", smClockKHz / 1000);
std::printf(" memory clock %8d MHz\n", memClockKHz / 1000);
std::printf(" memory bus %8d bits\n", busBits);
// 128 FP32 units per SM from compute capability 8.6; 2 FLOP per multiply-add.
double peakGflops = p.multiProcessorCount * 128 * 2.0 * smClockKHz / 1e6;
// 2 transfers per memory clock (double data rate) of busBits / 8 bytes each.
double peakGBs = 2.0 * memClockKHz * 1e3 * (busBits / 8) / 1e9;
std::printf(" FP32 peak from the clock %8.0f GFLOP/s\n", peakGflops);
std::printf(" bandwidth from the clock %8.1f GB/s\n", peakGBs);
}
Orin, compute capability 8.7 NVIDIA Thor, compute capability 11.0
SMs 8 SMs 20
threads per SM, at most 1536 threads per SM, at most 1536
registers per SM 65536 registers per SM 65536
shared memory per SM 164 KiB shared memory per SM 228 KiB
L2 cache 2048 KiB L2 cache 32768 KiB
SM clock 1173 MHz SM clock 1048 MHz
memory clock 1173 MHz memory clock 4266 MHz
memory bus 256 bits memory bus 256 bits
FP32 peak from the clock 2402 GFLOP/s FP32 peak from the clock 5369 GFLOP/s
bandwidth from the clock 75.1 GB/s bandwidth from the clock 273.0 GB/s
The output of the 2 GPUs is printed side by side. Each line is a limit that we used in an earlier chapter. The number of SMs and the maximum number of threads per SM determine how many warps can be resident (Chapter 2). The number of registers per SM determined the occupancy of Chapter 9’s kernels. The L2 cache is a memory on the GPU chip, shared by all SMs, that keeps recently used data; each SM also has a smaller L1 cache of its own. The size of the L2 cache determines how large the data of a test must be for the test to measure memory rather than the cache (section 25.7).
The 2 peak rates require care. The FP32 peak is computed as for the small GPU above: the number of SMs × 128 FP32 units × 2 FLOP per multiply-add × the clock rate. For the first GPU, this gives 8 × 128 × 2 × 1.173 GHz = 2,402 GFLOP/s, which agrees with NVIDIA’s figure of 2.4 TFLOP/s, given in the GPU’s data sheet, the specification that the manufacturer publishes. The memory peak is 2 transfers per memory clock × the bus width in bytes. For the second GPU, this gives 2 × 4.266 GHz × 32 bytes = 273.0 GB/s, which agrees with NVIDIA’s figure. The other 2 results, however, are wrong. The first GPU reports its SM clock as the memory clock and a bus of 256 bits where its data sheet gives 128 bits, so the product, 75.1 GB/s, falls below the 102 GB/s of the data sheet. The second GPU reports 1,048 MHz as its SM clock, while its data-sheet peak of 8.1 TFLOP/s implies 8,100 / (20 × 128 × 2) = 1.58 GHz. A peak rate computed from reported attributes is therefore only a starting point, and the data sheet is the reference. In this chapter, we use the data-sheet peaks of Chapter 2: 2.4 TFLOP/s and 102 GB/s for the first GPU, and 8.1 TFLOP/s and 273 GB/s for the second.
25.3.3 Speed-of-light analysis without counters
Let us begin with a kernel small enough to count by hand: y = 2 x over 4 floats. Each thread
reads 1 element of x, 4 bytes, multiplies it by 2, and writes 1 element of y, 4 more bytes.
The 4 threads together move 4 × 8 = 32 bytes and perform 4 FLOP. Whatever the length of the
arrays, the kernel performs 1 FLOP for every 8 bytes it moves. Now suppose that the kernel ran on
the small GPU of section 25.3.2, with 16 GFLOP/s and 16 GB/s, and that it moved 16 GB in 2 s. Its
memory rate would be 16 GB / 2 s = 8 GB/s, half of the memory peak. In the same 2 s it would
perform 16 GB / 8 bytes = 2 × 10⁹ FLOP, a rate of 1 GFLOP/s, or 1 / 16 = 6% of the
arithmetic peak. The memory system would be far busier than the arithmetic units, and the kernel’s
time would be limited by memory.
Definition 25.3 Speed of light, arithmetic intensity and ridge point. The speed-of-light percentage of a kernel for 1 unit is the rate that the kernel achieved on that unit divided by the unit’s peak rate. The arithmetic intensity of a kernel is the number of FLOP it performs per byte it moves. The ridge point of a GPU is its arithmetic peak divided by its memory bandwidth. A kernel whose arithmetic intensity lies below the ridge point is memory-bound: its time is limited by the memory bandwidth.
Example. y = 2 x has an arithmetic intensity of 1 FLOP / 8 bytes = 0.125 FLOP/B. The first
GPU has a ridge point of 2,400 GFLOP/s / 102 GB/s ≈ 24 FLOP/B, so y = 2 x is memory-bound on it.
For memory, the achieved rate is the number of bytes the kernel moves divided by its time. For
arithmetic, it is the number of operations divided by the time. The program measure.cu times the
kernel y = 2 x over 2 arrays of 256 MiB each, which is larger than the L2 cache of either GPU;
we explain in section 25.7 how the time was taken.
On the first GPU, the median time of the kernel is 8.35 ms. Each of the 67,108,864 elements is read once and written once, so the kernel moves 2 × 4 bytes per element, 536,870,912 bytes or 512 MiB in total. The achieved memory rate is therefore 536,870,912 bytes / 8.35 ms = 64.3 GB/s, which is 64.3 / 102 = 63% of the peak. The kernel performs 1 multiplication per element, 67,108,864 FLOP in total, so its arithmetic rate is 67,108,864 FLOP / 8.35 ms = 8.0 GFLOP/s, or 8.0 / 2,400 = 0.33% of the peak. The kernel is memory-bound: its arithmetic intensity, 1 FLOP per 8 bytes or 0.125 FLOP/B, lies far below the GPU’s ridge point of 24 FLOP/B (Chapter 2, section 2.1.5).
Let us now apply the same analysis to Chapter 9’s best kernel, in which each thread computes a 4 × 4 patch of \(C\). The kernel ran at 901.4 GFLOP/s on the first GPU, which is 901.4 / 2,400 = 38% of the arithmetic peak. Its memory side requires a count of the loads. Recall that a tile is a rectangular piece of a matrix that a block copies into shared memory and uses many times. Each block of 256 threads computes a 64 × 64 tile of \(C\). At each of its 4,096 / 16 = 256 steps, the block loads a 64 × 16 tile of \(A\) and a 16 × 64 tile of \(B\), 2,048 floats in total. Over the whole run, a block therefore loads 256 × 2,048 × 4 bytes = 2 MiB, and the 4,096 blocks load 8 GiB, or 8,589,934,592 bytes, in 152.47 ms. This is a load rate of 56.3 GB/s.
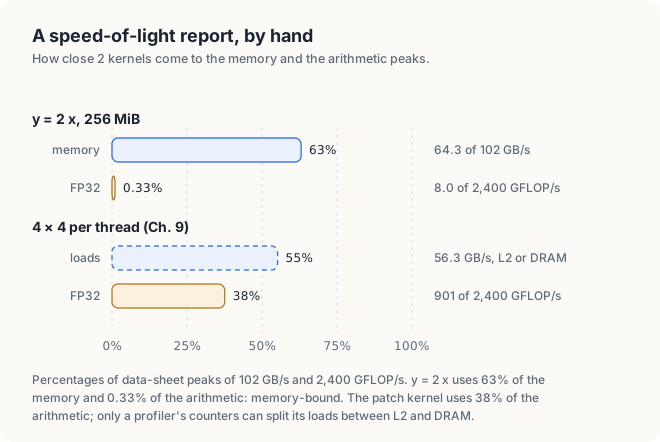
Figure 25.3 draws both results. The second one shows the limit of an analysis done by hand. The
56.3 GB/s of loads are served by the L2 cache or by DRAM, and the program cannot tell which. Tiles
that several blocks need may stay in the 2 MiB L2 cache between their uses. If all loads came from
DRAM, the kernel would use 55% of the memory peak; if most came from L2, it would use much less.
ncu reads this split from counters (dram__bytes and the L2 hit rate) and reports it directly.
The achieved occupancy and the stall reasons are likewise available only from counters.
The theoretical occupancy, on the other hand, can be computed without counters. The CUDA function
cudaOccupancyMaxActiveBlocksPerMultiprocessor, which we mentioned in Chapter 2, returns how many
blocks of a given size fit on 1 SM, given the registers and shared memory of the kernel.
Listing 25.2 The theoretical occupancy of scale.
fn main() -> Result<(), Error> {
// ...
let scale = module.prepare_scale(LaunchConfig1D::new(1, 256, 0))?;
let blocks = scale.function().max_active_blocks_per_multiprocessor(256, 0)?;
println!("blocks of 256 per SM {blocks:7} = {} threads", blocks * 256);
// ...
}int main()
{
// ...
int blocks;
check(cudaOccupancyMaxActiveBlocksPerMultiprocessor(&blocks, scale, 256, 0));
std::printf("blocks of 256 per SM %7d = %d threads\n", blocks, blocks * 256);
// ...
}
blocks of 256 per SM 6 = 1536 threads
Six blocks of 256 threads are 1,536 threads, or 48 warps, which is the limit of an SM on both GPUs. The theoretical occupancy of the kernel is therefore 48 / 48 = 100%.
25.4 Compute Sanitizer
25.4.1 Bugs that produce no error
The most dangerous bugs of a GPU program produce no error message. An allocation is a range of
memory returned by a single call such as cudaMalloc. A kernel that writes past the end of an array
usually writes into memory that belongs to no allocation, or to another array of the same program.
The hardware raises no fault, the error by which a processor stops an illegal access, and the
launch reports success.
Compute Sanitizer finds such bugs by instrumentation: it rewrites the kernel so that every
load, store and barrier first calls a check, and then runs the rewritten kernel. For example, the
statement c[i] = a[i] + b[i] contains 2 loads and 1 store. In the rewritten kernel, each of the 3
accesses is preceded by a call that looks up the address in the table of the program’s
allocations and reports an error if the 4 bytes at that address do not lie inside one of them. A
kernel with 3 accesses per thread thus makes 3 additional calls per thread, each far more costly
than the access it checks.
Two more terms appear in the table of checkers. An access is misaligned when its address is
not a multiple of its size, such as a 4-byte load from address 6. A race is a pair of
accesses to the same location by different threads, at least one of them a write, with nothing
that orders them; we work an example in section 25.4.3. The tool has 4 checkers, selected with the
option --tool:
| Checker | Finds |
|---|---|
memcheck (the default) | loads and stores outside any allocation, misaligned accesses, errors from CUDA calls |
racecheck | 2 accesses to the same shared-memory location, at least one of them a write, with no barrier between them |
synccheck | barriers used in ways the hardware does not define |
initcheck | loads of global memory that nothing has written |
The program bugs.cu contains 1 bug for each checker, each taken from an earlier chapter. We build
it with -lineinfo, which records for each instruction the source line it came from, so that the
checkers can report line numbers:
$ nvcc -arch=native -lineinfo bugs.cu -o bugs
$ ./bugs bounds; ./bugs race; ./bugs barrier; ./bugs uninit # second GPU
1,024 threads for 1,000 elements: 0 wrong elements
64 blocks of 256 ones: 64 wrong block sums
2 barriers, 1 per branch: 0 wrong elements of 256
sum of 1,024 floats nobody wrote: 0
The exit status of a program is the number it returns to the shell when it ends, and 0 means success. On the second GPU, all 4 runs exit with status 0, and 3 of the 4 print a result that looks correct. The first GPU printed the same lines for 3 of the bugs; in section 25.4.4 we describe what it did with the fourth.
25.4.2 Out-of-bounds accesses (memcheck)
Recall from Chapter 3 that we round the number of threads up to a whole number of blocks, and that
the kernel needs a guard, if (i < n), so that the extra threads do nothing. Consider a small
case first: 10 elements and blocks of 4 threads. Two blocks give only 8 threads, so we launch 3
blocks, 12 threads. Thread \(t\) of block \(b\) handles element \(i = 4b + t\), and the last
block covers \(i\) = 8, 9, 10 and 11. Elements 10 and 11 do not exist, so without the guard
threads 2 and 3 of block 2 read and write the 2 positions immediately past the end of each array.
Listing 25.3 leaves the guard out.
Listing 25.3 Vector addition without its guard. code/ch16_profiling/bugs.cu
mod kernels {
// ...
/// 1. Chapter 3's vector addition without its guard `if let Some(..)`.
#[cfg(feature = "no_guard")]
#[kernel]
#[launch_contract(domain = 1, block = (256, 1, 1))]
pub fn add_no_guard(a: &[f32], b: &[f32], mut c: DisjointSlice<f32>) {
let i = thread::index_1d();
let k = i.get();
*c.get_mut(i) = a[k] + b[k];
}
// ...
}In Rust, get_mut returns an Option, which is None for an index past the end of c, so the
guard cannot be left out, and the compiler rejects the kernel:
$ cargo oxide build --features no_guard
error[E0614]: type `Option<&mut f32>` cannot be dereferenced
--> src/main.rs:25:9
|
25 | *c.get_mut(i) = a[k] + b[k];
| ^^^^^^^^^^^^^ can't be dereferenced
// 1. Chapter 3's vector addition without its guard `if (i < n)`.
__global__ void addNoGuard(const float* a, const float* b, float* c, int n)
{
int i = blockIdx.x * blockDim.x + threadIdx.x;
c[i] = a[i] + b[i];
}
The program launches 4 blocks of 256 threads, 1,024 threads in total, for 1,000 elements.
Threads 1,000 to 1,023 therefore read a[i] and b[i] and write c[i] past the end of each
array. Nevertheless, all 1,000 elements of c were correct. memcheck shows why:
$ compute-sanitizer --tool memcheck ./bugs bounds
========= Invalid __global__ read of size 4 bytes
========= at addNoGuard(const float *, const float *, float *, int)+0xa0 in bugs.cu:23
========= by thread (232,0,0) in block (3,0,0)
========= Access to 0xfffd63800fa0 is out of bounds
========= and is 1 bytes after the nearest allocation at 0xfffd63800000 of size
========= 4,000 bytes
...
========= Access to 0xfffd63800fd0 is out of bounds
========= and is 48 bytes before the nearest allocation at 0xfffd63801000 of size
========= 4,000 bytes
...
CUDA error: unspecified launch failure
========= ERROR SUMMARY: 25 errors
Thread 232 of block 3 has the index 3 × 256 + 232 = 1,000, which is the first element past the end.
The array a starts at address ...800000, and the next allocation starts at ...801000, 0x1000
= 4,096 bytes later. In other words, cudaMalloc placed each array of 4,000 bytes at the start of a
4,096-byte slot. The unused bytes between the end of an array and the end of its slot are called
padding. The 24 extra threads access 24 × 4 = 96 bytes past the end of each array, which is
exactly the 4,096 − 4,000 = 96 bytes of padding, as Figure 25.4 shows. Because no other array was
affected, the bug was invisible in the output. With 1,010 elements, the slots would hold only
4,096 − 4,040 = 56 bytes of padding, and the last 10 threads would write into the next array.
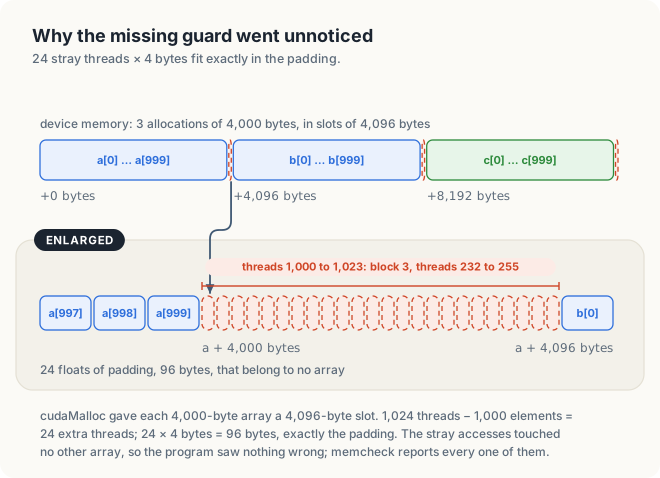
memcheck reports 24 invalid reads, 1 for each extra thread, and stops the kernel. The program’s next
CUDA call then fails, which is the 25th error. The same check applied to Chapter 3’s program, which
has the guard, ends with ERROR SUMMARY: 0 errors.
25.4.3 Shared-memory races (racecheck)
In Chapter 5, we summed 256 values per block as a tree in shared memory, with a barrier after each
level of the tree. Let us recall the method on 8 values, held by 8 threads in an array s in
shared memory:
s = [3, 1, 4, 1, 5, 9, 2, 6]
stride 4: s[t] ← s[t] + s[t + 4] for t < 4 s = [8, 10, 6, 7, ...]
stride 2: s[t] ← s[t] + s[t + 2] for t < 2 s = [14, 17, ...]
stride 1: s[t] ← s[t] + s[t + 1] for t < 1 s = [31, ...]
Each level halves the number of active threads, and after log2 8 = 3 levels s[0]
holds the sum, 31. At the first level, thread 0 reads s[4], a value that thread 4 stored. Now
suppose that threads 0 to 3 form 1 warp and threads 4 to 7 another, and that the first warp
reaches the addition before the second has stored its values. Thread 0 then reads whatever s[4]
held before, for example 0, and the block sum becomes 3 + 0 + … instead of 3 + 5 + …. The
barrier after the stores forbids this order. No thread may read until every thread has stored.
Definition 25.4 Race. A race is a pair of accesses to the same location by different threads, at least one of them a write, with nothing that orders them.
Example. In the sum of 8 values without a barrier, the store of s[4] by thread 4 and the read
of s[4] by thread 0 form a race.
Listing 25.4 leaves the barriers out of the sum of 256 values.
Listing 25.4 A block sum without barriers.
mod kernels {
// ...
/// 2. Chapter 5's block sum with its barriers left out.
#[kernel]
#[launch_contract(domain = 1, block = (256, 1, 1))]
pub fn sum_no_barrier(input: &[f32], mut out: DisjointSlice<f32>) {
static mut S: SharedArray<f32, 256> = SharedArray::UNINIT;
let t = thread::threadIdx_x() as usize;
let block = thread::blockIdx_x() as usize;
// SAFETY: none. No barrier orders these stores before the loads below: the bug.
unsafe { S[t] = input[block * 256 + t] };
let mut step: usize = 0;
#[unroll]
while step < 8 {
let stride: usize = 128 >> step;
if t < stride {
// SAFETY: none, as above.
unsafe { S[t] += S[t + stride] };
}
step += 1;
}
if t == 0 {
// SAFETY: only thread 0 of each block writes, at its own block number.
unsafe { *out.get_unchecked_mut(block) = S[0] };
}
}
// ...
}// 2. Chapter 5's block sum with its barriers left out.
__global__ void sumNoBarrier(const float* in, float* out)
{
__shared__ float s[256];
int t = threadIdx.x;
s[t] = in[blockIdx.x * 256 + t];
for (int stride = 128; stride > 0; stride /= 2) {
if (t < stride) {
s[t] += s[t + stride];
}
}
if (t == 0) {
out[blockIdx.x] = s[0];
}
}
In Rust every access to the shared array S is unsafe, and the compiler accepts the kernel
without its barriers; the Rust program also printed 64 wrong block sums.
All 64 block sums were wrong, and racecheck reports the conflicting lines:
$ compute-sanitizer --tool racecheck ./bugs race
========= Error: Race reported between Write access at sumNoBarrier(...)+0x1a0 in bugs.cu:31
========= and Read access at sumNoBarrier(...)+0x130 in bugs.cu:35 [32768 hazards]
...
========= RACECHECK SUMMARY: 4 hazards displayed (3 errors, 1 warning)
racecheck calls each observed instance of a race a hazard; the count of 32,768 in the first
message is the number of times it observed the race between the same 2 lines. Line 31 stores
the value of each thread into s[t], and line 35 reads s[t + stride]. In the first step, thread 0 of warp 0 reads s[128], but s[128] is
written by thread 128, which belongs to warp 4. Nothing orders the 2 warps. Figure 25.5 shows the
case in which warp 0 reads the location before warp 4 has written it.
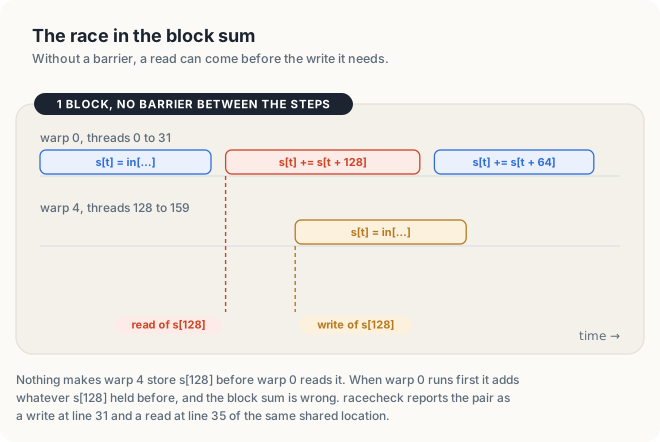
Key observation The warps of a block advance at different speeds, and nothing orders a store by 1 warp before a load by another. A value that 1 thread stores in shared memory and another thread loads needs a barrier between the store and the load.
25.4.4 Barriers in divergent code (synccheck)
The behavior of __syncthreads() is defined only when every thread of the block reaches the same
barrier instruction. The threads of a warp diverge when they take different branches of an
if statement, and the code inside such an if statement is called divergent code. Take a
block of 4 threads and the condition “\(t\) is even”. Threads 0 and 2 enter the first branch and
threads 1 and 3 the second. If each branch holds its own barrier, threads 0 and 2 wait at 1
barrier instruction while threads 1 and 3 wait at another, and neither barrier is reached by all
4 threads. Listing 25.5 places 1 barrier in each branch of an if statement in the same way, so
the even and odd threads of every warp wait at 2 different instructions.
Listing 25.5 2 barriers, 1 per branch.
mod kernels {
// ...
/// 3. Even and odd threads of each warp wait at 2 different barriers.
#[kernel]
#[launch_contract(domain = 1, block = (256, 1, 1))]
pub fn barrier_in_branch(mut out: DisjointSlice<f32>) {
static mut S: SharedArray<f32, 256> = SharedArray::UNINIT;
let t = thread::threadIdx_x() as usize;
// SAFETY: each thread writes only its own cell, before the barrier.
unsafe { S[t] = t as f32 };
if t % 2 == 0 {
thread::sync_threads();
} else {
thread::sync_threads();
}
let Some(o) = out.get_mut(thread::index_1d()) else {
return;
};
// SAFETY: after the barrier, no thread writes S.
*o = unsafe { S[255 - t] };
}
// ...
}// 3. Even and odd threads of each warp wait at 2 different barriers.
__global__ void barrierInBranch(float* out)
{
__shared__ float s[256];
int t = threadIdx.x;
s[t] = t;
if (t % 2 == 0) {
__syncthreads();
out[t] = s[255 - t];
} else {
__syncthreads();
out[t] = s[255 - t];
}
}
On the second GPU, the kernel produced the correct 256 elements, because the hardware happened to release both groups of threads together. On the first GPU, the same program never finished. The same source file thus gave 2 different outcomes on 2 GPUs. A program of this kind has undefined behavior: the language does not specify its result, so each machine may do something different. synccheck reports the cause:
$ compute-sanitizer --tool synccheck ./bugs barrier
========= Barrier error detected. Divergent thread(s) in warp.
========= at barrierInBranch(float *)+0xd0 in bugs.cu:52
========= by thread (64,0,0) in block (0,0,0)
...
========= ERROR SUMMARY: 128 errors
The 128 errors are 1 for each of the 128 even threads that waited at line 52 while the odd threads
of their warps waited at line 55. The correct kernel moves the barrier out of the if statement,
where all 256 threads reach it.
25.4.5 Reads of uninitialized memory (initcheck)
cudaMalloc returns memory that still holds whatever it last contained. Memory is
uninitialized until the program first writes it, and a load from uninitialized memory returns
a value that the program did not choose. Listing 25.6 sums 1,024 floats that nothing has written.
Listing 25.6 A sum of unwritten memory.
mod kernels {
// ...
/// 4. A sum over memory that nothing has written.
#[kernel]
#[launch_contract(domain = 1, block = (32, 1, 1))]
pub fn sum_unwritten(input: &[f32], total: &[DeviceAtomicF32]) {
let mut sum = 0.0;
let mut i = thread::threadIdx_x() as usize;
while i < input.len() {
sum += input[i];
i += 32;
}
total[0].fetch_add(sum, AtomicOrdering::Relaxed);
}
}// 4. A sum over memory that nothing has written.
__global__ void sumUnwritten(const float* in, float* out, int n)
{
float sum = 0.0f;
for (int i = threadIdx.x; i < n; i += 32) {
sum += in[i];
}
atomicAdd(out, sum);
}
In Rust, unwritten device memory comes only from the unsafe function
DeviceBuffer::uninitialized_async; the safe constructors zeroed and from_host write it first.
The result was 0, because the memory happened to contain zeros. initcheck reports all 1,024 reads, each with its thread:
$ compute-sanitizer --tool initcheck ./bugs uninit
========= Uninitialized __global__ memory read of size 4 bytes
========= at sumUnwritten(const float *, float *, int)+0x180 in bugs.cu:65
========= by thread (0,0,0) in block (0,0,0)
...
========= ERROR SUMMARY: 1024 errors
25.4.6 Overhead and limits of instrumentation
Every check adds work. The Rust program of section 25.6 measures a load from the L1 cache in 39
cycles. Under memcheck, the same loop took 8,463 cycles per load, 217 times as long. A run under
Compute Sanitizer therefore tells us whether a program is correct, but never how fast it is. The
same run ended with ERROR SUMMARY: 0 errors, which shows that programs written with cuda-oxide can
be checked in the same way as C++ programs.
A clean run, moreover, is evidence only about the inputs and the timing of that run. A race that did not occur in 1 run may occur in the next, and an out-of-bounds index that depends on the input may not be reached by the test input. In Section 25.8, we add tests that check the result itself.
The out-of-bounds kernel produced every element correctly and exited with status 0. A program that passes its tests can still access memory it does not own. Run Compute Sanitizer on every kernel before trusting it.
25.5 Debugging a kernel with cuda-gdb
cuda-gdb extends the GNU debugger, gdb, the standard debugger of Linux, with support for GPU
threads. A breakpoint on a line of a kernel stops the whole grid as soon as any thread reaches it.
At that moment thousands of threads are stopped, each with its own variables, and the debugger can
show the variables of only one of them at a time. The focus is the thread that the debugger
currently shows. The program is built with -G, which keeps device variables in a form the
debugger can read and turns off most optimizations, and with -g for the host code. A debugging
session can be scripted with -batch and 1 -ex option per command. In the session below, the
breakpoint has a condition, an expression that the debugger evaluates for each thread that
reaches the line; it stops only where the expression is true, here at thread 232 of block 3, the
first extra thread of section 25.4.2:
$ nvcc -arch=native -G -g bugs.cu -o bugs_debug
$ cuda-gdb -q -batch \
-ex 'break bugs.cu:23 if blockIdx.x == 3 && threadIdx.x == 232' \
-ex 'run bounds' -ex 'print i' -ex 'print n' -ex 'continue' ./bugs_debug
[Switching focus to CUDA kernel 0, grid 1, block (3,0,0), thread (232,0,0), device 0, sm 3,
warp 7, lane 8]
CUDA thread hit Breakpoint 1, addNoGuard<<<(4,1,1),(256,1,1)>>> (a=0x32b200000,
b=0x32b201000, c=0x32b202000, n=1000) at bugs.cu:23
23 c[i] = a[i] + b[i];
$1 = 1000
$2 = 1000
1,024 threads for 1,000 elements: 0 wrong elements
[Inferior 1 (process 3104365) exited normally]
The debugger confirms the reasoning of section 25.4.2 from inside the kernel. Thread 232 of block 3
has i = 1000, which equals n, and is about to access a[1000]. The focus line also locates the
thread in the hardware. The lane of a thread is its position within its warp, from 0 to 31.
Thread 232 belongs to warp 232 / 32 = 7, rounded down, at lane 232 − 7 × 32 = 8, and it ran on SM
3. The word Inferior in the last line is gdb’s name for the program being debugged. The 3 pointers lie 0x1000 = 4,096 bytes apart, which matches the slots of
Figure 25.4.
cuda-gdb is the tool for the bugs that Compute Sanitizer cannot detect, because they involve no
illegal access: wrong arithmetic on indices, a wrong weight in a stencil, or a branch taken by the
wrong threads.
25.6 Timing inside a kernel with clock64()
25.6.1 The per-SM cycle counter
Events measure the time of a whole kernel. To measure a few instructions, we need a clock that a
thread can read. The function clock64() returns the value of a 64-bit counter that each SM
increments once per cycle of its own clock. The difference between 2 readings taken by the same
thread is the number of cycles between them. The counters of different SMs are not synchronized,
so 2 readings can be compared only when the same thread took both.
In Chapter 1, we assumed 2 latencies, about 4 cycles for an addition and about 500 cycles for a
read from main memory, and argued from them that a GPU needs many threads. The program latency.cu
measures these latencies.
A clock that ticks once per cycle does not by itself show how long 1 operation takes, because an SM works on several operations at once. Suppose that a multiply-add takes 4 cycles from start to result, and that the SM can start a new one in every cycle. Consider 3 multiply-adds written 2 ways:
dependent: v ← v × 0.999 + 1; v ← v × 0.999 + 1; v ← v × 0.999 + 1
independent: a ← a × 0.999 + 1; b ← b × 0.999 + 1; c ← c × 0.999 + 1
In the first line, each operation needs the v that the previous one produced. The first runs
from cycle 0 to cycle 4, the second cannot start until cycle 4 and ends at cycle 8, and the third
ends at cycle 12: 3 operations take 3 × 4 = 12 cycles. In the second line, the 3 operations do not
need each other’s results, so the SM starts them in cycles 0, 1 and 2, and the last ends at cycle
6. 12 cycles divided by 3 operations gives 4 cycles, the time of 1 operation; 6 cycles divided by
3 gives 2 cycles, a number that depends on how many operations were in flight.
Definition 25.5 Latency and dependent chain. The latency of an operation is the time from its start to the moment its result can be used. A dependent chain is a sequence of operations in which each operation needs the result of the previous one, so that no 2 of them overlap.
Example. A dependent chain of 3 multiply-adds with a latency of 4 cycles takes 3 × 4 = 12 cycles.
Key observation The time of a dependent chain of \(k\) operations divided by \(k\) is the latency of 1 operation. To measure a latency, we time a long dependent chain and divide.
The pseudocode below shows the 2 measurements.
KERNEL dependentFma, 1 thread:
v ← x[0]
t0 ← clock64()
repeat 4,096 times:
v ← v × 0.999 + 1 # needs the v of the line before
t1 ← clock64()
x[0] ← v # keeps the compiler from deleting the loop
cycles ← t1 − t0
KERNEL chase(next, warm, hops), 1 thread:
j ← 0
repeat warm times: j ← next[j] # brings the chain into the caches
t0 ← clock64()
repeat hops times: j ← next[j] # each load needs the index the last one returned
t1 ← clock64()
out ← j
cycles ← t1 − t0
25.6.2 Latency of arithmetic
Listing 25.7 implements the first measurement in two forms.
Listing 25.7 1 dependent chain, and 4 independent chains, timed with clock64(). code/ch16_profiling/latency.cu
mod kernels {
// ...
/// 1 thread, 1 chain: each multiply-add needs the result of the one before.
#[kernel]
#[launch_contract(domain = 1, block = (1, 1, 1))]
pub fn dependent_fma(
start: f32,
mut out: DisjointSlice<f32>,
mut cycles: DisjointSlice<u64>,
) {
let mut v = start;
let t0 = debug::clock64();
let mut k = 0;
#[unroll(16)]
while k < STEPS {
v = float::fma_rn_f32(v, 0.999, 1.0);
k += 1;
}
let t1 = debug::clock64();
if let Some(o) = out.get_mut(thread::index_1d()) {
*o = v;
}
if let Some(c) = cycles.get_mut(thread::index_1d()) {
*c = t1 - t0;
}
}
/// 1 thread, 4 chains: the multiply-adds of 1 step do not wait for each other.
#[kernel]
#[launch_contract(domain = 1, block = (1, 1, 1))]
pub fn independent_fma(
start: f32,
mut out: DisjointSlice<f32>,
mut cycles: DisjointSlice<u64>,
) {
let (mut v0, mut v1, mut v2, mut v3) = (start, start, start, start);
let t0 = debug::clock64();
let mut k = 0;
#[unroll(4)]
while k < STEPS / 4 {
v0 = float::fma_rn_f32(v0, 0.999, 1.0);
v1 = float::fma_rn_f32(v1, 0.999, 1.0);
v2 = float::fma_rn_f32(v2, 0.999, 1.0);
v3 = float::fma_rn_f32(v3, 0.999, 1.0);
k += 1;
}
let t1 = debug::clock64();
if let Some(o) = out.get_mut(thread::index_1d()) {
*o = v0 + v1 + v2 + v3;
}
if let Some(c) = cycles.get_mut(thread::index_1d()) {
*c = t1 - t0;
}
}
// ...
}// 1 thread, 1 chain: each multiply-add needs the result of the one before.
__global__ void dependentFma(float* x, long long* cycles)
{
float v = x[0];
long long t0 = clock64();
for (int k = 0; k < STEPS; ++k) {
v = fmaf(v, 0.999f, 1.0f);
}
long long t1 = clock64();
x[0] = v;
cycles[0] = t1 - t0;
}
// 1 thread, 4 chains: the 4 multiply-adds of a step do not wait for each other.
__global__ void independentFma(float* x, long long* cycles)
{
float v0 = x[0], v1 = x[1], v2 = x[2], v3 = x[3];
long long t0 = clock64();
for (int k = 0; k < STEPS / 4; ++k) {
v0 = fmaf(v0, 0.999f, 1.0f);
v1 = fmaf(v1, 0.999f, 1.0f);
v2 = fmaf(v2, 0.999f, 1.0f);
v3 = fmaf(v3, 0.999f, 1.0f);
}
long long t1 = clock64();
x[0] = v0 + v1 + v2 + v3;
cycles[0] = t1 - t0;
}
The first kernel performs 4,096 multiply-adds as a single dependent chain. The second kernel performs the same 4,096 multiply-adds as 4 chains of 1,024. The 4 operations of each step do not depend on each other, so the SM can start each of them before the previous one has finished.
25.6.3 Latency of loads
A pointer chase measures the latency of a load. An array next holds, at each position, the
position of the next load, so that each load must wait for the one before it. Consider an array of
8 positions in which every position points 2 positions further on, wrapping around at the end:
position 0 1 2 3 4 5 6 7
next 2 3 4 5 6 7 0 1
A thread that starts at j = 0 loads next[0] = 2, then next[2] = 4, then next[4] = 6, then
next[6] = 0. It cannot issue the load of next[2] before the load of next[0] has returned,
because only that load tells it the position 2. The loads therefore form a dependent chain, and
their time divided by their number is the latency of 1 load. After \(k\) hops the thread stands
at position \(2k \bmod 8\), where \(x \bmod c\) is the remainder of \(x\) divided by \(c\):
after 4 hops, at 8 mod 8 = 0. The host builds the
array with a fixed step of 32 ints, 128 bytes, so that every load touches a new cache line, the
128-byte unit in which the caches hold data (Chapter 7, section 7.2). We use 3 chains of different
sizes, which are served from different levels of the memory hierarchy. A chain of 4 KiB fits in the
L1 cache. A chain of 1 MiB fits in the L2 cache but not in L1. The third chain spans 256 MiB with a
step of 1 MiB + 128 bytes and has no warm-up, so every load goes to DRAM.
Listing 25.8 The pointer chase.
mod kernels {
// ...
/// 1 thread follows a chain of indices; the first `warm` hops are not timed.
#[kernel]
#[launch_contract(domain = 1, block = (1, 1, 1))]
pub fn chase(
next: &[u32],
warm: u32,
hops: u32,
mut out: DisjointSlice<u32>,
mut cycles: DisjointSlice<u64>,
) {
let mut j = 0;
let mut k = 0;
while k < warm {
// SAFETY: the host builds every entry of `next` below next.len().
j = unsafe { *next.get_unchecked(j as usize) };
k += 1;
}
let t0 = debug::clock64();
k = 0;
while k < hops {
// SAFETY: as above.
j = unsafe { *next.get_unchecked(j as usize) };
k += 1;
}
let t1 = debug::clock64();
if let Some(o) = out.get_mut(thread::index_1d()) {
*o = j;
}
if let Some(c) = cycles.get_mut(thread::index_1d()) {
*c = t1 - t0;
}
}
}// 1 thread follows a chain: each load needs the index the load before returned.
// The first `warm` hops bring the chain into the caches; the next `hops` are timed.
__global__ void chase(const int* next, int warm, int hops, int* out, long long* cycles)
{
int j = 0;
for (int k = 0; k < warm; ++k) {
j = next[j];
}
long long t0 = clock64();
for (int k = 0; k < hops; ++k) {
j = next[j];
}
long long t1 = clock64();
out[0] = j;
cycles[0] = t1 - t0;
}
The host checks that each chain ended at the expected position: after \(w\) warm-up hops and \(h\) timed hops of step \(s\) through \(c\) positions, the index is \((w + h)\,s \bmod c\). In the array of 8 positions above, with \(s\) = 2, 1 warm-up hop and 3 timed hops end at (1 + 3) × 2 mod 8 = 0, the position we found by hand.
$ ./latency # first GPU
4096 multiply-adds in 1 thread, cycles per multiply-add
1 dependent chain 4.24
4 independent chains 1.31
1 thread follows a chain of loads, cycles per load
4 KiB chain, from L1 39
1 MiB chain, from L2 191
256 MiB chain, from DRAM 607
PASSED: 0 of 3 chains end in the wrong place
The program divides the cycles of the dependent chain by its 4,096 multiply-adds, which gives 4.24 cycles per operation, or about 17,400 cycles in total. The latency of a multiply-add is therefore about 4 cycles, as we assumed in Chapter 1; the extra 0.24 cycles come from the loop’s own counting and branching. With 4 independent chains, a multiply-add takes 1.31 cycles, so the SM completes about 4 times as many operations per cycle. This is what Little’s law predicts (Chapter 1, section 1.1.4). Little’s law states that the number of operations in flight equals the rate at which they complete multiplied by their latency, so the rate equals the number in flight divided by the latency. Four operations in flight with a latency of 4 cycles complete at a rate of 4 / 4 = 1 per cycle.
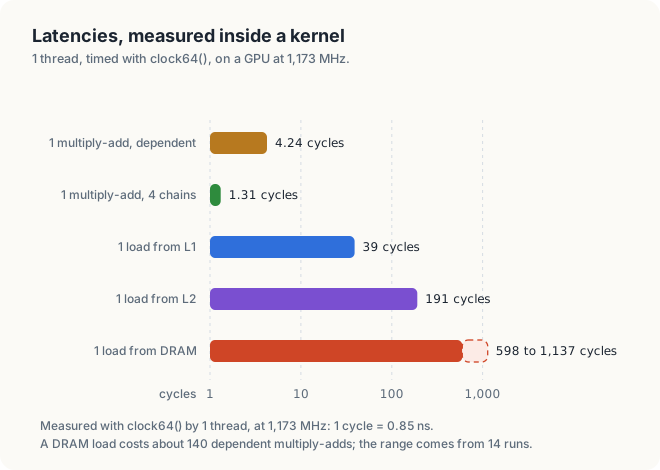
The loads can be converted from cycles to time in the same way. At 1,173 MHz, a cycle lasts 1 / 1.173 GHz = 0.85 ns, so a load from L1 takes 39 × 0.85 = 33 ns, a load from L2 takes 191 × 0.85 = 163 ns, and a load from DRAM takes 607 × 0.85 = 517 ns. A single load from DRAM thus costs as much time as 607 / 4.24 = 143 dependent multiply-adds.
Figure 25.6 places the 5 numbers on a logarithmic scale. The DRAM latency varied more than the others. Over 14 runs of the C++ and Rust programs, it ranged from 598 to 1,137 cycles. The L1 latency stayed at 39 cycles, and the L2 latency at 190 to 191 cycles in all runs but 2, which gave 431 and 689 cycles. On an integrated GPU, DRAM is shared with the CPU cores, the display and every other program, and the loads of a single thread wait behind theirs. For this reason, we report the DRAM latency as a range.
25.6.4 Latency measurement in Rust
cuda-oxide exposes the same counter as cuda_device::debug::clock64(), and the multiply-add as
cuda_device::float::fma_rn_f32, which rounds its exact result to the nearest float, like fmaf
in C++. The kernels launch 1 thread with the contract block = (1, 1, 1), a declaration that the
kernel is always launched with blocks of that shape. They write their results through
DisjointSlice, the slice type of Chapter 13 through which each thread writes only its own
elements. The chase of Listing 25.8 reads next with get_unchecked, which reads an element without first
comparing the index with the length of the slice; we explain why in section 25.9.
$ cargo oxide run # first GPU
4096 multiply-adds in 1 thread, cycles per multiply-add
1 dependent chain 4.07
4 independent chains 1.12
1 thread follows a chain of loads, cycles per load
4 KiB chain, from L1 39
1 MiB chain, from L2 191
256 MiB chain, from DRAM 599
PASSED: every chain ends where the host expects
The load latencies match those of the C++ program cycle for cycle. The multiply-add loops of the
Rust program are unrolled 16 and 4 times by #[unroll] (Chapter 9, section 9.7). Unrolling a
loop \(k\) times copies its body \(k\) times into each iteration, so that the loop counter is
updated and tested \(k\) times less often: a loop of 4,096 steps unrolled 16 times makes 256
iterations. Less of each step is therefore spent on counting, and the Rust kernels are 0.17 to
0.19 cycles faster per operation.
25.7 The benchmarking discipline
25.7.1 Warm-up effects
A benchmark is a measurement of a program’s speed made in such a way that it can be repeated
and compared. The first rule of benchmarking is to measure the program in the state in which it
will normally run. To show the difference, measure.cu times the kernel y = 2 x 40 times in a row with
events, starting after the GPU has been idle. Listing 25.9 shows how a single launch is timed.
Listing 25.9 1 launch, timed with 2 events.
/// The time of 1 launch of `scale`, in milliseconds, measured with 2 events.
fn time_scale(
stream: &CudaStream,
module: &kernels::LoadedModule,
x: &DeviceBuffer<f32>,
y: &mut DeviceBuffer<f32>,
) -> Result<f32, Error> {
let blocks = x.len().div_ceil(256) as u32;
let launch = module.prepare_scale(LaunchConfig1D::new(blocks, 256, 0))?;
let start = stream.record_event(Some(TIMING))?;
module.scale(stream, &launch, x, y)?;
let stop = stream.record_event(Some(TIMING))?;
stop.synchronize()?;
Ok(start.elapsed_ms(&stop)?)
}// The time of 1 launch of `scale`, in milliseconds, measured with 2 events.
float timeScale(const float* x, float* y, int n)
{
cudaEvent_t start, stop;
check(cudaEventCreate(&start));
check(cudaEventCreate(&stop));
check(cudaEventRecord(start));
scale<<<(n + 255) / 256, 256>>>(x, y, n);
check(cudaEventRecord(stop));
check(cudaEventSynchronize(stop));
float ms;
check(cudaEventElapsedTime(&ms, start, stop));
check(cudaEventDestroy(start));
check(cudaEventDestroy(stop));
return ms;
}
y = 2 x over 256 MiB, the first 40 runs in ms
19.83 14.43 10.63 13.25 10.64 11.40 10.62 9.67 8.48 8.46
8.47 8.47 8.46 8.47 10.43 8.39 8.37 8.38 8.35 8.35
8.34 8.35 8.36 8.33 8.32 8.36 10.33 8.38 8.40 8.35
8.34 8.34 12.91 9.80 8.36 8.35 8.36 8.36 8.34 8.35
mean of all 40 runs 9.46 ms
median of runs 21 to 40 8.35 ms
bytes moved 512 MiB
achieved bandwidth 64.3 GB/s
blocks of 256 per SM 6 = 1536 threads
PASSED: 0 of 67108864 elements wrong
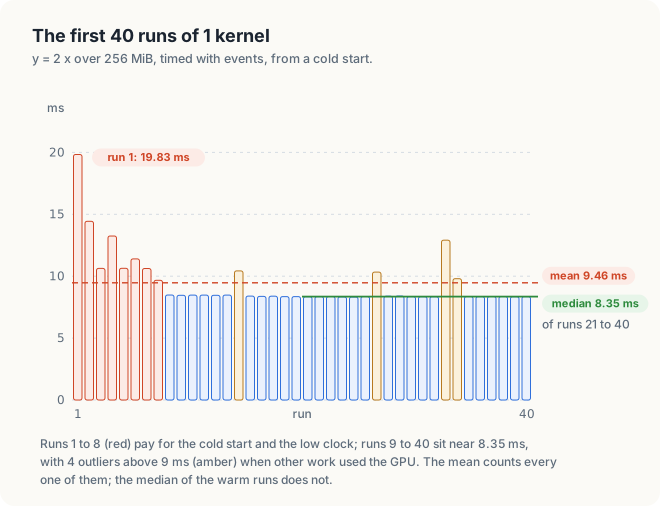
As Figure 25.7 shows, the same kernel on the same data took 19.83 ms the first time and 8.35 ms once warm. Two effects contribute to the difference. First, a first launch pays one-time costs, such as loading the kernel’s code onto the GPU. Second, a power governor, the part of the driver or firmware that sets the clock rate according to the load, lowers the GPU clock while the GPU is idle and raises it only after it has seen sustained load (Chapter 6). The governor of the Jetson modules behaves this way, so runs 2 to 8 executed at a lower clock. The runs after run 8 that took much longer than their neighbors, 10.43, 10.33, 12.91 and 9.80 ms, are outliers: single measurements far from the typical value, usually caused by something outside the program. When the program was run again immediately, while the clock was still high, its first run took 8.92 ms. A measurement taken without warm-up therefore depends on what the machine did in the seconds before it.
25.7.2 Mean and median
The mean of a set of times is their sum divided by their number. The median is the middle value once the times are sorted; for an even number of times, it is the mean of the 2 middle values. Consider 5 runs that took 8, 8, 8, 8 and 20 ms. The mean is (4 × 8 + 20) / 5 = 10.4 ms, longer than 4 of the 5 runs. The median is the third of the sorted times, 8 ms. If the slow run had taken 100 ms instead of 20 ms, the mean would rise to 26.4 ms, and the median would stay at 8 ms. In general, a single slow run moves the mean by its whole excess divided by the number of runs, but it moves the median at most to a neighboring value.
The 40 runs above illustrate the difference. The mean of all 40 runs is 9.46 ms, because the 8 warm-up runs and the 4 outliers pull it 1.11 ms above the typical run. When runs 21 to 40 are sorted, positions 10 and 11 both hold 8.35 ms, so their median is 8.35 ms. The outlier of 12.91 ms alone adds (12.91 − 8.35) / 40 = 0.11 ms to the mean of 40 runs, and nothing to the median.
The outliers came from other work on the GPU, such as a desktop that draws its windows with the same GPU. An earlier run of the same kernel, while that other work was heavier, gave a mean of 11.56 ms and a median of 9.74 ms. A busy machine shifts even the median, so a measurement protocol must also check that the machine is idle before it measures.
25.7.3 A measurement protocol
The following protocol collects these rules. Each rule prevents a mistake that we observed in the measurements of this chapter or of an earlier chapter.
BENCHMARK kernel:
check the GPU is idle # nvidia-smi or tegrastats
allocate every buffer before timing # no cudaMalloc inside the timed region
size the data well beyond the L2 cache # or the test measures the cache
run the kernel for about 0.4 s # warm-up: one-time costs, clocks
repeat R times:
record event start; launch; record event stop
times[r] ← elapsed(start, stop)
report median(times) and the spread # not the mean of a few runs
verify the output # a fast wrong kernel is not a result
record GPU, clocks, CUDA version, flags # the limits of listing 25.1
nvidia-smi and tegrastats are NVIDIA’s command-line tools that report the load and clock of
the GPU, on desktop and Jetson systems respectively. The spread of the times is the range from
the fastest to the slowest of the \(R\) runs. We use events rather than CPU clocks because a
launch returns to the CPU before the kernel ends;
in Chapter 6 we measured 0.07 ms for the launch call against 10.4 ms for the kernel itself. Events are
timestamped by the GPU. We size the data beyond the L2 cache because a test that fits in the cache
measures the cache. For example, on a GPU whose L2 cache holds 32 MiB, Chapter 7’s test on 16 MiB
of data reported 432 GB/s, above that GPU’s memory bandwidth of 273 GB/s. The 256 MiB arrays of
measure.cu are 128 times the size of an L2 cache of 2 MiB and 8 times that of an L2 cache of 32
MiB. We record the environment because the clocks, the compiler flags (-O3, -arch,
--use_fast_math) and the CUDA version all change results, and a number reported without them
cannot be reproduced. Finally, we run the whole program 3 times and quote a quiet run, and we expect
10% to 20% drift between runs on GPUs whose clocks change with load and temperature.
25.8 Verifying results
25.8.1 Units in the last place
A differential test compares a result with a trusted reference computed in another way,
usually on the CPU in double precision, the 64-bit floating-point format double, whose rounding
errors are far smaller than those of float. For integers, the comparison is exact. For
floating-point numbers, it needs a tolerance, the largest difference that still counts as
correct, and the tolerance needs a unit.
An absolute number such as 0.001 is not a good unit, and a small example shows the reason. Consider a small floating-point format that we invent for the purpose, with 8 evenly spaced values between each 2 consecutive powers of 2. Between 1 and 2, its values are 1, 1.125, 1.25, …, 1.875, which lie 1/8 = 0.125 apart. Between 2 and 4 there are again 8 values, 2, 2.25, 2.5, …, 3.75, now 0.25 apart, and between 8 and 16 the values are 8, 9, 10, …, 15, 1 apart. Rounding to the nearest value alone can move a result near 1.3 by up to 0.0625, half a step, but a result near 12 by up to 0.5. An error of 0.5 is therefore 4 steps near 1.3 and half a step near 12. A useful unit must therefore grow with the value, as the spacing does.
A float stores a number as a significand of 24 bits multiplied by a power of 2. Between 2 consecutive powers of 2, \(2^e\) and \(2^{e+1}\), there are therefore \(2^{23}\) floats, evenly spaced \(2^{e-23}\) apart, and the spacing doubles at every power of 2, exactly as in the small format.
Definition 25.6 Unit in the last place. 1 unit in the last place, or 1 ULP, is the spacing of the floats around a value. The error of a result in ULPs is its distance from the correct value divided by that spacing.
Example. In the small format, 1 ULP is 0.125 between 1 and 2 and 1 between 8 and 16. For a real float near 1, 1 ULP is \(2^{-23}\) ≈ 0.000000119.
Figure 25.8 draws the small floating-point format, so that the doubling of the spacing is visible.
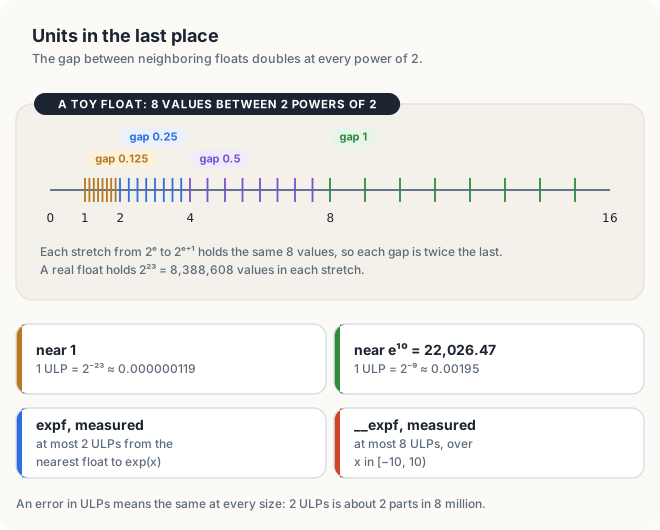
For example, e10 = 22,026.47 lies between 214 = 16,384 and 215 = 32,768, so \(e = 14\), and 1 ULP there is \(2^{14-23} = 2^{-9}\) = 0.00195. An error of 2 ULPs is therefore 0.0039 at 22,026.47 and \(2 \times 2^{-23}\) = 0.00000024 near 1. Both errors have the same relative size, the error divided by the value: about 1 part in 4 million.
Because positive floats are stored in order, the number of floats between 2 of them is the
difference of their bit patterns read as integers. For example, the float 1.0 has the bit pattern
0x3F80_0000, and the next larger float, 1 + 2−23, has the pattern 0x3F80_0001. The
difference of the two patterns read as integers is 1, and the 2 floats are 1 ULP apart. Listing 25.10 uses this property to measure the
error of expf, and of __expf, the faster hardware version that --use_fast_math substitutes,
against the nearest float to the exact value. --use_fast_math is a compiler flag of nvcc that
replaces standard math functions with faster and less accurate versions.
Listing 25.10 The distance between 2 floats in ULPs. code/ch16_profiling/verify.cu
/// The number of floats between a and b, for 2 floats of the same sign.
fn ulps(a: f32, b: f32) -> i64 {
let ia = a.to_bits() as i32 as i64;
let ib = b.to_bits() as i32 as i64;
(ia - ib).abs()
}
/// The largest distance in ULPs between y and the nearest float to exp(x).
fn exp_error(x: &[f32], y: &[f32]) -> i64 {
let mut worst = 0;
for (&x, &y) in x.iter().zip(y) {
let exact = (x as f64).exp() as f32;
worst = worst.max(ulps(y, exact));
}
worst
}// The number of floats between a and b, for 2 floats of the same sign.
int64_t ulps(float a, float b)
{
int32_t ia, ib;
std::memcpy(&ia, &a, sizeof(float));
std::memcpy(&ib, &b, sizeof(float));
return std::llabs(int64_t(ia) - int64_t(ib));
}
// The largest distance in ULPs between y and the nearest float to exp(x).
int64_t expError(const std::vector<float>& x, const std::vector<float>& y)
{
int64_t worst = 0;
for (size_t i = 0; i < x.size(); ++i) {
float exact = float(std::exp(double(x[i])));
worst = std::max(worst, ulps(y[i], exact));
}
return worst;
}
y = exp(x) for 1,048,576 values of x in [-10, 10)
expf largest error 2 ULPs
__expf largest error 8 ULPs
The CUDA programming guide gives expf a maximum error of 2 ULPs, and the measurement agrees. A
test of expf can therefore use a tolerance of 2 ULPs. The same test fails a kernel compiled with
--use_fast_math, so that flag is a decision about accuracy as well as about speed.
25.8.2 Tolerances for sums
A sum has no ULP bound of its own, because its error grows with the number of additions. Each addition of 2 floats rounds its exact result to the nearest float. Rounding to the nearest float moves a value by at most half a ULP, and half a ULP is at most \(u = 2^{-24}\) of the value. For example, the floats between 1 and 2 lie \(2^{-23}\) apart, so rounding a result near 1 moves it by at most \(2^{-24}\).
Consider 4 inputs summed in two ways. As a tree, \((x_0 + x_1) + (x_2 + x_3)\), every input passes through 2 additions on its way to the total. In a loop, \(((x_0 + x_1) + x_2) + x_3\), the inputs \(x_0\) and \(x_1\) pass through 3 additions, \(x_2\) through 2 and \(x_3\) through 1. Each addition that an input passes through may round the partial sum that contains it, and so adds an error of at most \(u\) times that partial sum. An input element that passes through \(d\) additions on its way to the total therefore contributes rounding errors of at most \(d\,u\) times its own size, and the error of the sum is bounded by
\[ |\text{error}| \le d \cdot u \cdot \sum_i |x_i| \]
| Symbol | Meaning | In the example |
|---|---|---|
| \(d\) | most additions any element passes through | 84 |
| \(u\) | largest relative rounding of 1 addition | \(2^{-24}\) = 5.96 × 10⁻⁸ |
| \(\sum_i \lvert x_i \rvert\) | sum of the sizes of the inputs | 8,391,134.58 |
| \(d\,u\sum_i \lvert x_i \rvert\) | the tolerance | 42.01 |
The program verify.cu sums 16,777,216 random floats in [0, 1) with the 2-launch reduction of
Chapter 8. To obtain the tolerance, we count the additions that an element can pass through.
Worked example: \(d\) for the 2-launch sum
- Launch 1 runs 1,024 blocks of 256 threads, 262,144 threads in total. We let each thread add 16,777,216 / 262,144 = 64 elements in a loop: up to 64 additions.
- Its block then adds the 256 thread sums as a tree of log2 256 = 8 levels: 8 more additions.
- Launch 2 runs 1 block of 256 threads over the 1,024 block sums: 4 additions per thread, then 8 levels of the tree.
- \(d\) = 64 + 8 + 4 + 8 = 84, and the tolerance is 84 × 2−24 × 8,391,134.58 = 42.01.
Listing 25.11 The sum tested against its tolerance, and against a known answer.
/// Sum x on the GPU twice: correctly, and as a caller passing 1 element too few.
fn sum_test(
stream: &CudaStream,
module: &kernels::LoadedModule,
title: &str,
x: &[f32],
tolerance: f64,
) -> Result<(), Error> {
let n = x.len() as u32;
let dx = DeviceBuffer::from_host(stream, x)?;
let mut partial = DeviceBuffer::<f32>::zeroed(stream, 1024)?;
let mut total = DeviceBuffer::<f32>::zeroed(stream, 1)?;
let exact: f64 = x.iter().map(|&v| v as f64).sum();
let good_sum = gpu_sum(stream, module, &dx, n, &mut partial, &mut total)?;
let bad_sum = gpu_sum(stream, module, &dx, n - 1, &mut partial, &mut total)?;
let good = (good_sum as f64 - exact).abs();
let bad = (bad_sum as f64 - exact).abs();
let good_verdict = verdict(good, tolerance);
let bad_verdict = verdict(bad, tolerance);
println!("{title}");
println!(" exact sum {exact:12.2}");
println!(" tolerance {tolerance:12.2}");
println!(" n elements error {good:6.2} {good_verdict}");
println!(" n - 1 elements error {bad:6.2} {bad_verdict}");
Ok(())
}
fn main() -> Result<(), Error> {
let ctx = CudaContext::new(0)?;
let stream = ctx.default_stream();
// SAFETY: the loaded code was compiled from the `kernels` module above.
let module = unsafe { kernels::load(&ctx)? };
exp_test(&stream, &module)?;
let n = 1 << 24;
let mut state: u32 = 1;
let mut magnitude = 0.0;
let mut random = Vec::with_capacity(n);
for _ in 0..n {
state = state.wrapping_mul(1_664_525).wrapping_add(1_013_904_223);
let v = (state >> 8) as f32 / 16_777_216.0;
magnitude += v as f64;
random.push(v);
}
// Each element passes through at most 84 additions on the way to the total:
// 64 + 8 in launch 1, 4 + 8 in launch 2. Each rounds by 2^-24 of its sum at most.
let bound = 84.0 * 2f64.powi(-24) * magnitude;
let title = "sum of 16,777,216 random floats in [0, 1)";
sum_test(&stream, &module, title, &random, bound)?;
// Partial sums of ones are whole numbers up to 2^24, which floats hold exactly.
let ones = vec![1.0f32; n];
sum_test(&stream, &module, "sum of 16,777,216 ones", &ones, 0.0)?;
Ok(())
}// Sum x on the GPU twice: correctly, and as a caller passing 1 element too few.
void sumTest(const char* title, const std::vector<float>& x, double tolerance)
{
int n = x.size();
float *dx, *partial;
check(cudaMalloc(&dx, n * sizeof(float)));
check(cudaMalloc(&partial, 1025 * sizeof(float)));
check(cudaMemcpy(dx, x.data(), n * sizeof(float), cudaMemcpyHostToDevice));
double exact = 0.0;
for (float v : x) {
exact += v;
}
double good = std::fabs(gpuSum(dx, n, partial) - exact);
double bad = std::fabs(gpuSum(dx, n - 1, partial) - exact);
std::printf("%s\n", title);
std::printf(" exact sum %12.2f\n", exact);
std::printf(" tolerance %12.2f\n", tolerance);
std::printf(" n elements error %6.2f %s\n", good, verdict(good, tolerance));
std::printf(" n - 1 elements error %6.2f %s\n", bad, verdict(bad, tolerance));
check(cudaFree(dx));
check(cudaFree(partial));
}
int main()
{
expTest();
const int n = 1 << 24;
std::vector<float> random(n), ones(n, 1.0f);
uint32_t state = 1;
double magnitude = 0.0;
for (float& v : random) {
state = state * 1664525u + 1013904223u;
v = (state >> 8) / 16777216.0f;
magnitude += v;
}
// Each element passes through at most 84 additions on the way to the total:
// 64 + 8 in launch 1, 4 + 8 in launch 2. Each rounds by 2^-24 of its sum at most.
double bound = 84 * std::ldexp(1.0, -24) * magnitude;
sumTest("sum of 16,777,216 random floats in [0, 1)", random, bound);
// Partial sums of ones are whole numbers up to 2^24, which floats hold exactly.
sumTest("sum of 16,777,216 ones", ones, 0.0);
return 0;
}
25.8.3 Known-answer and property tests
The test runs the sum twice: once correctly, and once through a caller that passes \(n - 1\) instead of \(n\). An off-by-one error is a count or an index that is 1 too large or 1 too small, and it is among the most common bugs in loops over arrays. Here, the faulty sum leaves out the last element.
sum of 16,777,216 random floats in [0, 1)
exact sum 8391134.58
tolerance 42.01
n elements error 0.42 PASSED
n - 1 elements error 0.58 PASSED
sum of 16,777,216 ones
exact sum 16777216.00
tolerance 0.00
n elements error 0.00 PASSED
n - 1 elements error 1.00 FAILED
The bug passes the differential test. The missing element is smaller than 1, while the tolerance is 42.01, and a test that allows for rounding cannot detect an error smaller than the rounding it allows. The second input detects the bug. When every element equals 1, every partial sum is a whole number no larger than 224 = 16,777,216. A float represents every whole number up to 224 exactly, so no addition rounds, the correct answer is exact, and the tolerance is 0. Figure 25.9 places both results.
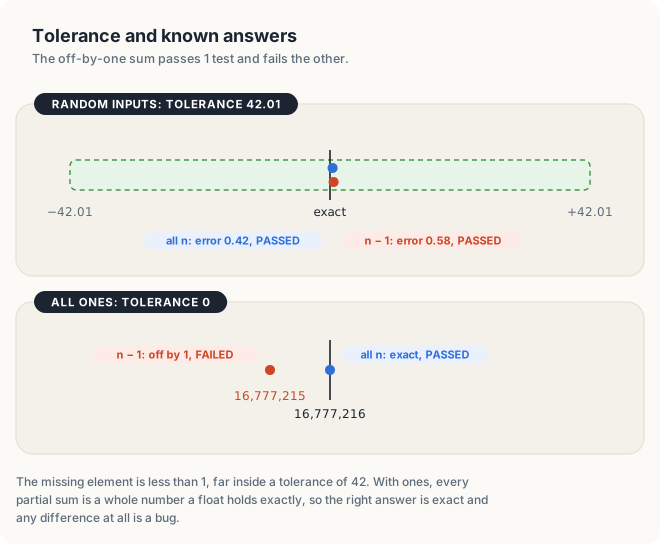
A known-answer test chooses its input so that the correct result is known exactly. A property test checks a relation that every correct result satisfies, whatever the input. For example, the counts of a histogram add up to the number of elements (Chapters 5 and 8), a transpose applied twice gives back the input (Chapter 7), and the last element of an inclusive scan equals the sum of the input. Recall that an inclusive scan replaces each element by the sum of itself and all elements before it: the scan of [3, 1, 4] is [3, 4, 8], and its last element, 8, is the sum of the input. Property tests need no reference at all, so they also detect bugs that a reference shares with the code it checks.
A tolerance wide enough for rounding is wide enough to hide small bugs. Add inputs whose answer is known exactly, and test them with a tolerance of 0.
25.9 A systematic optimization process
The tools of this chapter fit into a single procedure, which we followed in every earlier chapter:
- Measure, using the protocol of section 25.7.
- Form a hypothesis, a proposed cause that a measurement can confirm or refute, using the timeline, the counters or a count by hand.
- Change one thing.
- Measure again, in the same way.
- Verify that the results are still correct.
Figure 25.10 applies the procedure to a case from this chapter. The first Rust version of the
pointer chase indexed next[j as usize] in a for loop and measured 62 cycles per L1 load,
against 39 cycles in C++. Rust performs a bounds check before every indexing operation such as
next[j]: it compares the index with the length of the slice, and it stops the program if the
index lies past the end, instead of reading another array’s memory. Our hypothesis was that the
bounds check of next[j] lies on the dependent chain. The check compares j with the length of
the slice before each load, so each load must wait for the index returned by the previous load and
then for the comparison.
The first attempt replaced the for loop with a while loop and the indexing with
get_unchecked at the same time, and it measured 39 cycles. Because two things had changed, the
measurement could not tell which change mattered. Measured separately, the while loop with the
bounds check still took 62 cycles. The bounds check alone accounted for the 23 cycles, and the form
of the loop for none of them.
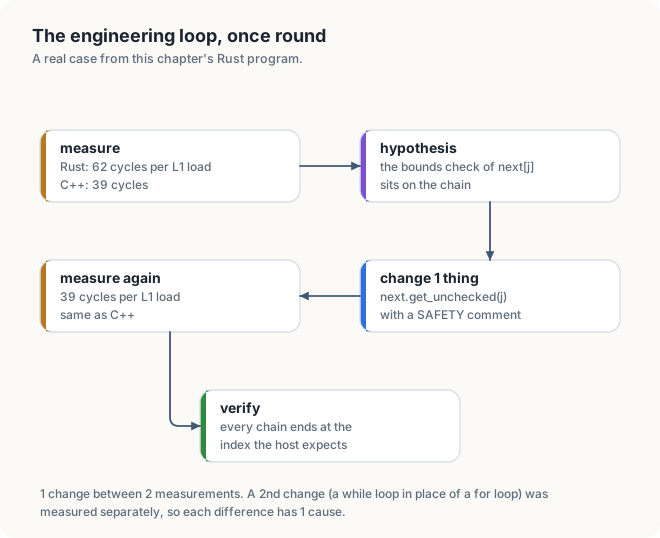
The L2 latencies also changed, from 408 cycles to 295 and then to 191, but each of these was a
single run, and 2 runs of the final program gave 431 and 689 cycles. These differences may be
noise, so we draw no conclusion from them. Finally, verification confirmed that every chain still
ended at the index the host predicts, and the SAFETY comment in the code records why the
unchecked load stays within bounds.
Most of the analysis in the earlier chapters concerns step 2. The roofline model of Chapter 1 tells us whether a kernel is limited by memory or by arithmetic, the coalescing rules of Chapter 7 tell us how many sectors a warp moves, and the reuse count of Chapter 9 tells us how often each value is fetched. Recall that coalescing is the combining of the accesses of a warp’s 32 threads into as few memory transactions as possible, and that a sector is the 32-byte unit in which the memory system moves data. The procedure above is how each of these explanations was checked.
25.10 The complete programs
Listing 25.12 The complete bugs programs. code/oxide/ch16_bugs/src/main.rs and code/ch16_profiling/bugs.cu
//! Chapter 16 in Rust: the bugs of bugs.cu, for Compute Sanitizer to find.
//!
//! cargo oxide run -- race | barrier | uninit
//! cargo oxide build --features no_guard # the bounds bug: does not compile
use std::sync::Arc;
use cuda_core::{CudaContext, CudaStream, DeviceBuffer, LaunchConfig1D};
use cuda_device::atomic::{AtomicOrdering, DeviceAtomicF32};
use cuda_device::{DisjointSlice, SharedArray, cuda_module, kernel, launch_contract, thread};
type Error = Box<dyn std::error::Error>;
#[cuda_module]
mod kernels {
use super::*;
/// 1. Chapter 3's vector addition without its guard `if let Some(..)`.
#[cfg(feature = "no_guard")]
#[kernel]
#[launch_contract(domain = 1, block = (256, 1, 1))]
pub fn add_no_guard(a: &[f32], b: &[f32], mut c: DisjointSlice<f32>) {
let i = thread::index_1d();
let k = i.get();
*c.get_mut(i) = a[k] + b[k];
}
/// 2. Chapter 5's block sum with its barriers left out.
#[kernel]
#[launch_contract(domain = 1, block = (256, 1, 1))]
pub fn sum_no_barrier(input: &[f32], mut out: DisjointSlice<f32>) {
static mut S: SharedArray<f32, 256> = SharedArray::UNINIT;
let t = thread::threadIdx_x() as usize;
let block = thread::blockIdx_x() as usize;
// SAFETY: none. No barrier orders these stores before the loads below: the bug.
unsafe { S[t] = input[block * 256 + t] };
let mut step: usize = 0;
#[unroll]
while step < 8 {
let stride: usize = 128 >> step;
if t < stride {
// SAFETY: none, as above.
unsafe { S[t] += S[t + stride] };
}
step += 1;
}
if t == 0 {
// SAFETY: only thread 0 of each block writes, at its own block number.
unsafe { *out.get_unchecked_mut(block) = S[0] };
}
}
/// 3. Even and odd threads of each warp wait at 2 different barriers.
#[kernel]
#[launch_contract(domain = 1, block = (256, 1, 1))]
pub fn barrier_in_branch(mut out: DisjointSlice<f32>) {
static mut S: SharedArray<f32, 256> = SharedArray::UNINIT;
let t = thread::threadIdx_x() as usize;
// SAFETY: each thread writes only its own cell, before the barrier.
unsafe { S[t] = t as f32 };
if t % 2 == 0 {
thread::sync_threads();
} else {
thread::sync_threads();
}
let Some(o) = out.get_mut(thread::index_1d()) else {
return;
};
// SAFETY: after the barrier, no thread writes S.
*o = unsafe { S[255 - t] };
}
/// 4. A sum over memory that nothing has written.
#[kernel]
#[launch_contract(domain = 1, block = (32, 1, 1))]
pub fn sum_unwritten(input: &[f32], total: &[DeviceAtomicF32]) {
let mut sum = 0.0;
let mut i = thread::threadIdx_x() as usize;
while i < input.len() {
sum += input[i];
i += 32;
}
total[0].fetch_add(sum, AtomicOrdering::Relaxed);
}
}
fn race(stream: &Arc<CudaStream>, module: &kernels::LoadedModule) -> Result<(), Error> {
let blocks = 64;
let input = DeviceBuffer::from_host(stream, &vec![1.0f32; blocks * 256])?;
let mut out = DeviceBuffer::<f32>::zeroed(stream, blocks)?;
let launch = module.prepare_sum_no_barrier(LaunchConfig1D::new(blocks as u32, 256, 0))?;
module.sum_no_barrier(stream, &launch, &input, &mut out)?;
let sums = out.to_host_vec(stream)?;
let wrong = sums.iter().filter(|&&sum| sum != 256.0).count();
println!("{blocks} blocks of 256 ones: {wrong} wrong block sums");
Ok(())
}
fn barrier(stream: &Arc<CudaStream>, module: &kernels::LoadedModule) -> Result<(), Error> {
let mut out = DeviceBuffer::<f32>::zeroed(stream, 256)?;
let launch = module.prepare_barrier_in_branch(LaunchConfig1D::new(1, 256, 0))?;
module.barrier_in_branch(stream, &launch, &mut out)?;
let values = out.to_host_vec(stream)?;
let wrong = (0..256).filter(|&t| values[t] != (255 - t) as f32).count();
println!("2 barriers, 1 per branch: {wrong} wrong elements of 256");
Ok(())
}
fn uninit(stream: &Arc<CudaStream>, module: &kernels::LoadedModule) -> Result<(), Error> {
let n = 1024;
// SAFETY: none. Nothing writes `input` before the kernel reads it: the bug.
let input = unsafe { DeviceBuffer::<f32>::uninitialized_async(stream, n)? };
let total = DeviceBuffer::<f32>::zeroed(stream, 1)?.cast_elem::<DeviceAtomicF32>();
let launch = module.prepare_sum_unwritten(LaunchConfig1D::new(1, 32, 0))?;
module.sum_unwritten(stream, &launch, &input, &total)?;
let sum = total.cast_elem::<f32>().to_host_vec(stream)?[0];
println!("sum of 1,024 floats nobody wrote: {sum}");
Ok(())
}
fn main() -> Result<(), Error> {
let ctx = CudaContext::new(0)?;
let stream = ctx.default_stream();
// SAFETY: the loaded code was compiled from the `kernels` module above.
let module = unsafe { kernels::load(&ctx)? };
match std::env::args().nth(1).as_deref() {
Some("race") => race(&stream, &module)?,
Some("barrier") => barrier(&stream, &module)?,
Some("uninit") => uninit(&stream, &module)?,
_ => return Err("usage: cargo oxide run -- race | barrier | uninit".into()),
}
ctx.synchronize()?;
Ok(())
}// Chapter 16: 4 bugs that print no error, for Compute Sanitizer to find.
// Build: nvcc -arch=native -lineinfo bugs.cu -o bugs
// Run: ./bugs bounds | race | barrier | uninit
#include <cstdio>
#include <cstdlib>
#include <cstring>
#include <vector>
#include <cuda_runtime.h>
void check(cudaError_t err)
{
if (err != cudaSuccess) {
std::fprintf(stderr, "CUDA error: %s\n", cudaGetErrorString(err));
std::exit(1);
}
}
// 1. Chapter 3's vector addition without its guard `if (i < n)`.
__global__ void addNoGuard(const float* a, const float* b, float* c, int n)
{
int i = blockIdx.x * blockDim.x + threadIdx.x;
c[i] = a[i] + b[i];
}
// 2. Chapter 5's block sum with its barriers left out.
__global__ void sumNoBarrier(const float* in, float* out)
{
__shared__ float s[256];
int t = threadIdx.x;
s[t] = in[blockIdx.x * 256 + t];
for (int stride = 128; stride > 0; stride /= 2) {
if (t < stride) {
s[t] += s[t + stride];
}
}
if (t == 0) {
out[blockIdx.x] = s[0];
}
}
// 3. Even and odd threads of each warp wait at 2 different barriers.
__global__ void barrierInBranch(float* out)
{
__shared__ float s[256];
int t = threadIdx.x;
s[t] = t;
if (t % 2 == 0) {
__syncthreads();
out[t] = s[255 - t];
} else {
__syncthreads();
out[t] = s[255 - t];
}
}
// 4. A sum over memory that nothing has written.
__global__ void sumUnwritten(const float* in, float* out, int n)
{
float sum = 0.0f;
for (int i = threadIdx.x; i < n; i += 32) {
sum += in[i];
}
atomicAdd(out, sum);
}
void bounds()
{
const int n = 1000;
std::vector<float> a(n, 1.0f), b(n, 2.0f), c(n);
size_t bytes = n * sizeof(float);
float *da, *db, *dc;
check(cudaMalloc(&da, bytes));
check(cudaMalloc(&db, bytes));
check(cudaMalloc(&dc, bytes));
check(cudaMemcpy(da, a.data(), bytes, cudaMemcpyHostToDevice));
check(cudaMemcpy(db, b.data(), bytes, cudaMemcpyHostToDevice));
addNoGuard<<<4, 256>>>(da, db, dc, n);
check(cudaGetLastError());
check(cudaMemcpy(c.data(), dc, bytes, cudaMemcpyDeviceToHost));
int wrong = 0;
for (int i = 0; i < n; ++i) {
wrong += c[i] != 3.0f;
}
std::printf("1,024 threads for 1,000 elements: %d wrong elements\n", wrong);
check(cudaFree(da));
check(cudaFree(db));
check(cudaFree(dc));
}
void race()
{
const int blocks = 64;
std::vector<float> in(blocks * 256, 1.0f), out(blocks);
float *din, *dout;
check(cudaMalloc(&din, in.size() * sizeof(float)));
check(cudaMalloc(&dout, blocks * sizeof(float)));
check(cudaMemcpy(din, in.data(), in.size() * sizeof(float), cudaMemcpyHostToDevice));
sumNoBarrier<<<blocks, 256>>>(din, dout);
check(cudaGetLastError());
check(cudaMemcpy(out.data(), dout, blocks * sizeof(float), cudaMemcpyDeviceToHost));
int wrong = 0;
for (float sum : out) {
wrong += sum != 256.0f;
}
std::printf("%d blocks of 256 ones: %d wrong block sums\n", blocks, wrong);
check(cudaFree(din));
check(cudaFree(dout));
}
void barrier()
{
std::vector<float> out(256);
float* dout;
check(cudaMalloc(&dout, 256 * sizeof(float)));
barrierInBranch<<<1, 256>>>(dout);
check(cudaGetLastError());
check(cudaMemcpy(out.data(), dout, 256 * sizeof(float), cudaMemcpyDeviceToHost));
int wrong = 0;
for (int t = 0; t < 256; ++t) {
wrong += out[t] != 255 - t;
}
std::printf("2 barriers, 1 per branch: %d wrong elements of 256\n", wrong);
check(cudaFree(dout));
}
void uninit()
{
const int n = 1024;
float *din, *dout;
check(cudaMalloc(&din, n * sizeof(float)));
check(cudaMalloc(&dout, sizeof(float)));
check(cudaMemset(dout, 0, sizeof(float)));
sumUnwritten<<<1, 32>>>(din, dout, n);
check(cudaGetLastError());
float sum;
check(cudaMemcpy(&sum, dout, sizeof(float), cudaMemcpyDeviceToHost));
std::printf("sum of 1,024 floats nobody wrote: %g\n", sum);
check(cudaFree(din));
check(cudaFree(dout));
}
int main(int argc, char** argv)
{
const char* bug = argc > 1 ? argv[1] : "";
if (std::strcmp(bug, "bounds") == 0) {
bounds();
} else if (std::strcmp(bug, "race") == 0) {
race();
} else if (std::strcmp(bug, "barrier") == 0) {
barrier();
} else if (std::strcmp(bug, "uninit") == 0) {
uninit();
} else {
std::fprintf(stderr, "usage: bugs bounds | race | barrier | uninit\n");
return 1;
}
check(cudaDeviceSynchronize());
return 0;
}
Listing 25.13 The complete measure programs. code/oxide/ch16_measure/src/main.rs and code/ch16_profiling/measure.cu
//! Chapter 16 in Rust: the GPU's limits, the warm-up effect, and a kernel report by hand.
//!
//! cargo oxide run
use cuda_core::sys::CUevent_flags_enum_CU_EVENT_DEFAULT as TIMING;
use cuda_core::sys::{CUdevice, CUdevice_attribute, cuDeviceGetAttribute};
use cuda_core::sys::{
CUdevice_attribute_enum_CU_DEVICE_ATTRIBUTE_CLOCK_RATE as SM_CLOCK,
CUdevice_attribute_enum_CU_DEVICE_ATTRIBUTE_GLOBAL_MEMORY_BUS_WIDTH as BUS_BITS,
CUdevice_attribute_enum_CU_DEVICE_ATTRIBUTE_L2_CACHE_SIZE as L2_BYTES,
CUdevice_attribute_enum_CU_DEVICE_ATTRIBUTE_MAX_REGISTERS_PER_MULTIPROCESSOR as REGS,
// shared memory per SM, in bytes
CUdevice_attribute_enum_CU_DEVICE_ATTRIBUTE_MAX_SHARED_MEMORY_PER_MULTIPROCESSOR as SHM,
CUdevice_attribute_enum_CU_DEVICE_ATTRIBUTE_MEMORY_CLOCK_RATE as MEM_CLOCK,
};
use cuda_core::{CudaContext, CudaStream, DeviceBuffer, DriverError, IntoResult};
use cuda_core::LaunchConfig1D;
use cuda_device::{DisjointSlice, cuda_module, kernel, launch_contract, thread};
type Error = Box<dyn std::error::Error>;
#[cuda_module]
mod kernels {
use super::*;
#[kernel]
#[launch_contract(domain = 1, block = (256, 1, 1))]
pub fn fill(mut x: DisjointSlice<f32>) {
let i = thread::index_1d();
let k = i.get();
if let Some(v) = x.get_mut(i) {
*v = (k % 1000) as f32;
}
}
/// y = 2 x: reads 4 bytes and writes 4 bytes per element.
#[kernel]
#[launch_contract(domain = 1, block = (256, 1, 1))]
pub fn scale(x: &[f32], mut y: DisjointSlice<f32>) {
let i = thread::index_1d();
let k = i.get();
if let Some(v) = y.get_mut(i) {
*v = 2.0 * x[k];
}
}
}
/// The time of 1 launch of `scale`, in milliseconds, measured with 2 events.
fn time_scale(
stream: &CudaStream,
module: &kernels::LoadedModule,
x: &DeviceBuffer<f32>,
y: &mut DeviceBuffer<f32>,
) -> Result<f32, Error> {
let blocks = x.len().div_ceil(256) as u32;
let launch = module.prepare_scale(LaunchConfig1D::new(blocks, 256, 0))?;
let start = stream.record_event(Some(TIMING))?;
module.scale(stream, &launch, x, y)?;
let stop = stream.record_event(Some(TIMING))?;
stop.synchronize()?;
Ok(start.elapsed_ms(&stop)?)
}
/// Asks the driver for 1 integer attribute of `device`.
fn attribute(device: CUdevice, which: CUdevice_attribute) -> Result<i32, DriverError> {
let mut value = 0;
// SAFETY: `value` is a valid place for 1 integer; `device` came from a live context.
unsafe { cuDeviceGetAttribute(&mut value, which, device).result()? };
Ok(value)
}
/// Print the limits the GPU reports, and the peaks they imply.
fn limits(ctx: &CudaContext) -> Result<(), DriverError> {
let device = ctx.cu_device();
let (major, minor) = ctx.compute_capability()?;
let sms = ctx.multiprocessor_count()?;
let sm_clock_khz = attribute(device, SM_CLOCK)?;
let mem_clock_khz = attribute(device, MEM_CLOCK)?;
let bus_bits = attribute(device, BUS_BITS)?;
let shared_kib = attribute(device, SHM)? / 1024;
let l2_kib = attribute(device, L2_BYTES)? / 1024;
let registers = attribute(device, REGS)?;
let max_threads = ctx.max_threads_per_multiprocessor()?;
let name = ctx.device_name()?;
println!("{name}, compute capability {major}.{minor}");
println!(" SMs {sms:8}");
println!(" threads per SM, at most {max_threads:8}");
println!(" registers per SM {registers:8}");
println!(" shared memory per SM {shared_kib:8} KiB");
println!(" L2 cache {l2_kib:8} KiB");
println!(" SM clock {:8} MHz", sm_clock_khz / 1000);
println!(" memory clock {:8} MHz", mem_clock_khz / 1000);
println!(" memory bus {bus_bits:8} bits");
// 128 FP32 units per SM from compute capability 8.6; 2 FLOP per multiply-add.
let peak_gflops = sms as f64 * 128.0 * 2.0 * sm_clock_khz as f64 / 1e6;
// 2 transfers per memory clock (double data rate) of bus_bits / 8 bytes each.
let peak_gbs = 2.0 * mem_clock_khz as f64 * 1e3 * (bus_bits / 8) as f64 / 1e9;
println!(" FP32 peak from the clock {peak_gflops:8.0} GFLOP/s");
println!(" bandwidth from the clock {peak_gbs:8.1} GB/s");
Ok(())
}
fn main() -> Result<(), Error> {
let ctx = CudaContext::new(0)?;
let stream = ctx.default_stream();
// SAFETY: the loaded code was compiled from the `kernels` module above.
let module = unsafe { kernels::load(&ctx)? };
limits(&ctx)?;
let n: usize = 64 << 20; // 67,108,864 floats, 256 MiB per array
let bytes = 2.0 * (n * size_of::<f32>()) as f64;
let mut x = DeviceBuffer::<f32>::zeroed(&stream, n)?;
let mut y = DeviceBuffer::<f32>::zeroed(&stream, n)?;
let fill = module.prepare_fill(LaunchConfig1D::new(n.div_ceil(256) as u32, 256, 0))?;
module.fill(&stream, &fill, &mut x)?;
stream.synchronize()?;
// The first 40 runs of y = 2 x.
let mut ms = Vec::with_capacity(40);
for _ in 0..40 {
let t = time_scale(&stream, &module, &x, &mut y)?;
ms.push(t);
}
println!("y = 2 x over 256 MiB, the first 40 runs in ms");
for (r, t) in ms.iter().enumerate() {
let end = if r % 10 == 9 { "\n" } else { "" };
print!(" {t:5.2}{end}");
}
let total: f64 = ms.iter().map(|&t| t as f64).sum();
let mean = total / ms.len() as f64;
let mut last = ms[20..].to_vec();
last.sort_by(f32::total_cmp);
let median = (last[9] + last[10]) / 2.0;
println!("mean of all 40 runs {mean:7.2} ms");
println!("median of runs 21 to 40 {median:7.2} ms");
// The report by hand: bytes moved / time.
let gbs = bytes / (median as f64 * 1e-3) / 1e9;
let mib = bytes / (1 << 20) as f64;
println!("bytes moved {mib:7.0} MiB");
println!("achieved bandwidth {gbs:7.1} GB/s");
let scale = module.prepare_scale(LaunchConfig1D::new(1, 256, 0))?;
let blocks = scale.function().max_active_blocks_per_multiprocessor(256, 0)?;
println!("blocks of 256 per SM {blocks:7} = {} threads", blocks * 256);
let result = y.to_host_vec(&stream)?;
let expected = |i: usize| 2.0 * (i % 1000) as f32;
let wrong = (0..n).filter(|&i| result[i] != expected(i)).count();
let verdict = if wrong == 0 { "PASSED" } else { "FAILED" };
println!("{verdict}: {wrong} of {n} elements wrong");
if wrong > 0 {
return Err("wrong elements".into());
}
Ok(())
}// Chapter 16: the GPU's limits, the warm-up effect, and a kernel report by hand.
// Build: nvcc -arch=native measure.cu -o measure
#include <algorithm>
#include <cstdio>
#include <cstdlib>
#include <vector>
#include <cuda_runtime.h>
void check(cudaError_t err)
{
if (err != cudaSuccess) {
std::fprintf(stderr, "CUDA error: %s\n", cudaGetErrorString(err));
std::exit(1);
}
}
int attribute(cudaDeviceAttr attr)
{
int value;
check(cudaDeviceGetAttribute(&value, attr, 0));
return value;
}
__global__ void fill(float* x, int n)
{
int i = blockIdx.x * blockDim.x + threadIdx.x;
if (i < n) {
x[i] = i % 1000;
}
}
// y = 2 x: reads 4 bytes and writes 4 bytes per element.
__global__ void scale(const float* x, float* y, int n)
{
int i = blockIdx.x * blockDim.x + threadIdx.x;
if (i < n) {
y[i] = 2.0f * x[i];
}
}
// The time of 1 launch of `scale`, in milliseconds, measured with 2 events.
float timeScale(const float* x, float* y, int n)
{
cudaEvent_t start, stop;
check(cudaEventCreate(&start));
check(cudaEventCreate(&stop));
check(cudaEventRecord(start));
scale<<<(n + 255) / 256, 256>>>(x, y, n);
check(cudaEventRecord(stop));
check(cudaEventSynchronize(stop));
float ms;
check(cudaEventElapsedTime(&ms, start, stop));
check(cudaEventDestroy(start));
check(cudaEventDestroy(stop));
return ms;
}
// Print the limits the GPU reports, and the peaks they imply.
void limits()
{
    cudaDeviceProp p;
    check(cudaGetDeviceProperties(&p, 0));

    int smClockKHz = attribute(cudaDevAttrClockRate);
    int memClockKHz = attribute(cudaDevAttrMemoryClockRate);
    int busBits = attribute(cudaDevAttrGlobalMemoryBusWidth);
    size_t sharedKiB = p.sharedMemPerMultiprocessor / 1024;

    std::printf("%s, compute capability %d.%d\n", p.name, p.major, p.minor);
    std::printf("  SMs                       %8d\n", p.multiProcessorCount);
    std::printf("  threads per SM, at most   %8d\n", p.maxThreadsPerMultiProcessor);
    std::printf("  registers per SM          %8d\n", p.regsPerMultiprocessor);
    std::printf("  shared memory per SM      %8zu KiB\n", sharedKiB);
    std::printf("  L2 cache                  %8d KiB\n", p.l2CacheSize / 1024);
    std::printf("  SM clock                  %8d MHz\n", smClockKHz / 1000);
    std::printf("  memory clock              %8d MHz\n", memClockKHz / 1000);
    std::printf("  memory bus                %8d bits\n", busBits);

    // 128 FP32 units per SM from compute capability 8.6; 2 FLOP per multiply-add.
    double peakGflops = p.multiProcessorCount * 128 * 2.0 * smClockKHz / 1e6;

    // 2 transfers per memory clock (double data rate) of busBits / 8 bytes each.
    double peakGBs = 2.0 * memClockKHz * 1e3 * (busBits / 8) / 1e9;

    std::printf("  FP32 peak from the clock  %8.0f GFLOP/s\n", peakGflops);
    std::printf("  bandwidth from the clock  %8.1f GB/s\n", peakGBs);
}
int main()
{
limits();
const int n = 64 << 20; // 67,108,864 floats, 256 MiB per array
const double bytes = 2.0 * n * sizeof(float);
float *x, *y;
check(cudaMalloc(&x, n * sizeof(float)));
check(cudaMalloc(&y, n * sizeof(float)));
fill<<<(n + 255) / 256, 256>>>(x, n);
check(cudaDeviceSynchronize());
// The first 40 runs of y = 2 x.
std::vector<float> ms(40);
for (float& t : ms) {
t = timeScale(x, y, n);
}
std::printf("y = 2 x over 256 MiB, the first 40 runs in ms\n");
for (int r = 0; r < 40; ++r) {
const char* end = r % 10 == 9 ? "\n" : "";
std::printf(" %5.2f%s", ms[r], end);
}
double mean = 0.0;
for (float t : ms) {
mean += t / ms.size();
}
std::vector<float> last(ms.begin() + 20, ms.end());
std::sort(last.begin(), last.end());
float median = (last[9] + last[10]) / 2;
std::printf("mean of all 40 runs %7.2f ms\n", mean);
std::printf("median of runs 21 to 40 %7.2f ms\n", median);
// The report by hand: bytes moved / time.
double gbs = bytes / (median * 1e-3) / 1e9;
std::printf("bytes moved %7.0f MiB\n", bytes / (1 << 20));
std::printf("achieved bandwidth %7.1f GB/s\n", gbs);
int blocks;
check(cudaOccupancyMaxActiveBlocksPerMultiprocessor(&blocks, scale, 256, 0));
std::printf("blocks of 256 per SM %7d = %d threads\n", blocks, blocks * 256);
std::vector<float> result(n);
check(cudaMemcpy(result.data(), y, n * sizeof(float), cudaMemcpyDeviceToHost));
int wrong = 0;
for (int i = 0; i < n; ++i) {
wrong += result[i] != 2.0f * (i % 1000);
}
const char* verdict = wrong ? "FAILED" : "PASSED";
std::printf("%s: %d of %d elements wrong\n", verdict, wrong, n);
check(cudaFree(x));
check(cudaFree(y));
return wrong ? 1 : 0;
}
Listing 25.14 The complete latency programs. code/oxide/ch16_latency/src/main.rs and code/ch16_profiling/latency.cu
//! Chapter 16 in Rust: latencies in cycles, measured inside a kernel with clock64().
//!
//! cargo oxide run
use cuda_core::{CudaContext, CudaStream, DeviceBuffer, LaunchConfig1D};
use cuda_device::{DisjointSlice, cuda_module, kernel, launch_contract, thread};
use cuda_device::{debug, float};
const STEPS: u32 = 4096;
type Error = Box<dyn std::error::Error>;
#[cuda_module]
mod kernels {
use super::*;
/// 1 thread, 1 chain: each multiply-add needs the result of the one before.
#[kernel]
#[launch_contract(domain = 1, block = (1, 1, 1))]
pub fn dependent_fma(
start: f32,
mut out: DisjointSlice<f32>,
mut cycles: DisjointSlice<u64>,
) {
let mut v = start;
let t0 = debug::clock64();
let mut k = 0;
#[unroll(16)]
while k < STEPS {
v = float::fma_rn_f32(v, 0.999, 1.0);
k += 1;
}
let t1 = debug::clock64();
if let Some(o) = out.get_mut(thread::index_1d()) {
*o = v;
}
if let Some(c) = cycles.get_mut(thread::index_1d()) {
*c = t1 - t0;
}
}
/// 1 thread, 4 chains: the multiply-adds of 1 step do not wait for each other.
#[kernel]
#[launch_contract(domain = 1, block = (1, 1, 1))]
pub fn independent_fma(
start: f32,
mut out: DisjointSlice<f32>,
mut cycles: DisjointSlice<u64>,
) {
let (mut v0, mut v1, mut v2, mut v3) = (start, start, start, start);
let t0 = debug::clock64();
let mut k = 0;
#[unroll(4)]
while k < STEPS / 4 {
v0 = float::fma_rn_f32(v0, 0.999, 1.0);
v1 = float::fma_rn_f32(v1, 0.999, 1.0);
v2 = float::fma_rn_f32(v2, 0.999, 1.0);
v3 = float::fma_rn_f32(v3, 0.999, 1.0);
k += 1;
}
let t1 = debug::clock64();
if let Some(o) = out.get_mut(thread::index_1d()) {
*o = v0 + v1 + v2 + v3;
}
if let Some(c) = cycles.get_mut(thread::index_1d()) {
*c = t1 - t0;
}
}
/// 1 thread follows a chain of indices; the first `warm` hops are not timed.
#[kernel]
#[launch_contract(domain = 1, block = (1, 1, 1))]
pub fn chase(
next: &[u32],
warm: u32,
hops: u32,
mut out: DisjointSlice<u32>,
mut cycles: DisjointSlice<u64>,
) {
let mut j = 0;
let mut k = 0;
while k < warm {
// SAFETY: the host builds every entry of `next` below next.len().
j = unsafe { *next.get_unchecked(j as usize) };
k += 1;
}
let t0 = debug::clock64();
k = 0;
while k < hops {
// SAFETY: as above.
j = unsafe { *next.get_unchecked(j as usize) };
k += 1;
}
let t1 = debug::clock64();
if let Some(o) = out.get_mut(thread::index_1d()) {
*o = j;
}
if let Some(c) = cycles.get_mut(thread::index_1d()) {
*c = t1 - t0;
}
}
}
/// Cycles per load along a chain of `count` indices, each pointing `stride` ahead,
/// and whether the chain ended where the host expects.
fn chase_cycles(
stream: &CudaStream,
module: &kernels::LoadedModule,
count: u32,
stride: u32,
warm: u32,
hops: u32,
) -> Result<(f64, bool), Error> {
let chain: Vec<u32> = (0..count).map(|i| (i + stride) % count).collect();
let next = DeviceBuffer::from_host(stream, &chain)?;
let mut out = DeviceBuffer::<u32>::zeroed(stream, 1)?;
let mut cycles = DeviceBuffer::<u64>::zeroed(stream, 1)?;
let one = module.prepare_chase(LaunchConfig1D::new(1, 1, 0))?;
module.chase(stream, &one, &next, warm, hops, &mut out, &mut cycles)?;
let cycles = cycles.to_host_vec(stream)?[0] as f64 / hops as f64;
let end = out.to_host_vec(stream)?[0] as u64;
let expected = (warm + hops) as u64 * stride as u64 % count as u64;
Ok((cycles, end == expected))
}
fn main() -> Result<(), Error> {
let ctx = CudaContext::new(0)?;
let stream = ctx.default_stream();
// SAFETY: the loaded code was compiled from the `kernels` module above.
let module = unsafe { kernels::load(&ctx)? };
let mut out = DeviceBuffer::<f32>::zeroed(&stream, 1)?;
let mut cycles = DeviceBuffer::<u64>::zeroed(&stream, 1)?;
let one = LaunchConfig1D::new(1, 1, 0);
let dep = module.prepare_dependent_fma(one)?;
module.dependent_fma(&stream, &dep, 0.0, &mut out, &mut cycles)?;
let dependent = cycles.to_host_vec(&stream)?[0] as f64 / STEPS as f64;
let ind = module.prepare_independent_fma(one)?;
module.independent_fma(&stream, &ind, 0.0, &mut out, &mut cycles)?;
let independent = cycles.to_host_vec(&stream)?[0] as f64 / STEPS as f64;
println!("{STEPS} multiply-adds in 1 thread, cycles per multiply-add");
println!(" 1 dependent chain {dependent:6.2}");
println!(" 4 independent chains {independent:6.2}");
// 128-byte steps (32 indices), so that every load touches a new cache line.
// The DRAM chain jumps 1 MiB + 128 bytes per load and is not warmed first.
let (l1, ok1) = chase_cycles(&stream, &module, 1024, 32, 1024, 4096)?;
let (l2, ok2) = chase_cycles(&stream, &module, 256 << 10, 32, 8192, 8192)?;
let (dram, ok3) = chase_cycles(&stream, &module, 64 << 20, (1 << 18) + 32, 0, 4096)?;
println!("1 thread follows a chain of loads, cycles per load");
println!(" 4 KiB chain, from L1 {l1:6.0}");
println!(" 1 MiB chain, from L2 {l2:6.0}");
println!(" 256 MiB chain, from DRAM {dram:6.0}");
let wrong = [ok1, ok2, ok3].iter().filter(|ok| !**ok).count();
if wrong == 0 {
println!("PASSED: every chain ends where the host expects");
Ok(())
} else {
Err(format!("FAILED: {wrong} of 3 chains end in the wrong place").into())
}
}// Chapter 16: latencies in clock cycles, measured inside a kernel with clock64().
// Build: nvcc -arch=native latency.cu -o latency
#include <cstdio>
#include <cstdlib>
#include <vector>
#include <cuda_runtime.h>
void check(cudaError_t err)
{
if (err != cudaSuccess) {
std::fprintf(stderr, "CUDA error: %s\n", cudaGetErrorString(err));
std::exit(1);
}
}
const int STEPS = 4096;
// 1 thread, 1 chain: each multiply-add needs the result of the one before.
__global__ void dependentFma(float* x, long long* cycles)
{
    float v = x[0];

    long long t0 = clock64();
    for (int k = 0; k < STEPS; ++k) {
        v = fmaf(v, 0.999f, 1.0f);
    }
    long long t1 = clock64();

    x[0] = v;
    cycles[0] = t1 - t0;
}

// 1 thread, 4 chains: the 4 multiply-adds of a step do not wait for each other.
__global__ void independentFma(float* x, long long* cycles)
{
    float v0 = x[0], v1 = x[1], v2 = x[2], v3 = x[3];

    long long t0 = clock64();
    for (int k = 0; k < STEPS / 4; ++k) {
        v0 = fmaf(v0, 0.999f, 1.0f);
        v1 = fmaf(v1, 0.999f, 1.0f);
        v2 = fmaf(v2, 0.999f, 1.0f);
        v3 = fmaf(v3, 0.999f, 1.0f);
    }
    long long t1 = clock64();

    x[0] = v0 + v1 + v2 + v3;
    cycles[0] = t1 - t0;
}
// 1 thread follows a chain: each load needs the index the load before returned.
// The first `warm` hops bring the chain into the caches; the next `hops` are timed.
__global__ void chase(const int* next, int warm, int hops, int* out, long long* cycles)
{
    int j = 0;
    for (int k = 0; k < warm; ++k) {
        j = next[j];
    }

    long long t0 = clock64();
    for (int k = 0; k < hops; ++k) {
        j = next[j];
    }
    long long t1 = clock64();

    out[0] = j;
    cycles[0] = t1 - t0;
}
// Cycles per load along a chain of `count` ints, each pointing `stride` ints ahead.
// Counts in `wrong` a chain that does not end where the host expects.
double chaseCycles(int count, int stride, int warm, int hops, int& wrong)
{
std::vector<int> next(count);
for (int i = 0; i < count; ++i) {
next[i] = (i + stride) % count;
}
int *dnext, *dout;
long long* dcycles;
check(cudaMalloc(&dnext, count * sizeof(int)));
check(cudaMalloc(&dout, sizeof(int)));
check(cudaMalloc(&dcycles, sizeof(long long)));
check(cudaMemcpy(dnext, next.data(), count * sizeof(int), cudaMemcpyHostToDevice));
chase<<<1, 1>>>(dnext, warm, hops, dout, dcycles);
check(cudaGetLastError());
long long cycles;
int end;
check(cudaMemcpy(&cycles, dcycles, sizeof(long long), cudaMemcpyDeviceToHost));
check(cudaMemcpy(&end, dout, sizeof(int), cudaMemcpyDeviceToHost));
wrong += end != (long long)(warm + hops) * stride % count;
check(cudaFree(dnext));
check(cudaFree(dout));
check(cudaFree(dcycles));
return double(cycles) / hops;
}
int main()
{
float* x;
long long* dcycles;
check(cudaMalloc(&x, 4 * sizeof(float)));
check(cudaMalloc(&dcycles, sizeof(long long)));
check(cudaMemset(x, 0, 4 * sizeof(float)));
long long dep, ind;
size_t size = sizeof(long long);
dependentFma<<<1, 1>>>(x, dcycles);
check(cudaMemcpy(&dep, dcycles, size, cudaMemcpyDeviceToHost));
independentFma<<<1, 1>>>(x, dcycles);
check(cudaMemcpy(&ind, dcycles, size, cudaMemcpyDeviceToHost));
std::printf("%d multiply-adds in 1 thread, cycles per multiply-add\n", STEPS);
std::printf(" 1 dependent chain %6.2f\n", double(dep) / STEPS);
std::printf(" 4 independent chains %6.2f\n", double(ind) / STEPS);
// 128-byte steps (32 ints), so that every load touches a new cache line.
// The DRAM chain jumps 1 MiB + 128 bytes per load and is not warmed first.
int wrong = 0;
double l1 = chaseCycles(1024, 32, 1024, 4096, wrong); // 4 KiB, L1
double l2 = chaseCycles(256 << 10, 32, 8192, 8192, wrong); // 1 MiB, L2
double dram = chaseCycles(64 << 20, (1 << 18) + 32, 0, 4096, wrong); // 256 MiB
std::printf("1 thread follows a chain of loads, cycles per load\n");
std::printf(" 4 KiB chain, from L1 %6.0f\n", l1);
std::printf(" 1 MiB chain, from L2 %6.0f\n", l2);
std::printf(" 256 MiB chain, from DRAM %6.0f\n", dram);
const char* verdict = wrong ? "FAILED" : "PASSED";
std::printf("%s: %d of 3 chains end in the wrong place\n", verdict, wrong);
check(cudaFree(x));
check(cudaFree(dcycles));
return wrong ? 1 : 0;
}
Listing 25.15 The complete verify programs. code/oxide/ch16_verify/src/main.rs and code/ch16_profiling/verify.cu
//! Chapter 16 in Rust: GPU results against the CPU, with a tolerance worked out in advance.
//!
//! cargo oxide run
use std::f32::consts::LOG2_E;
use cuda_core::{CudaContext, CudaStream, DeviceBuffer, LaunchConfig1D};
use cuda_device::{DisjointSlice, SharedArray, cuda_module, float, kernel, launch_contract};
use cuda_device::thread;
type Error = Box<dyn std::error::Error>;
#[cuda_module]
mod kernels {
use super::*;
#[kernel]
#[launch_contract(domain = 1, block = (256, 1, 1))]
pub fn exp_accurate(x: &[f32], mut y: DisjointSlice<f32>) {
let i = thread::index_1d();
let k = i.get();
if let Some(v) = y.get_mut(i) {
*v = x[k].exp();
}
}
/// exp(x) as 2^(x log2 e), with the hardware's approximate 2^x, as __expf computes it.
#[kernel]
#[launch_contract(domain = 1, block = (256, 1, 1))]
pub fn exp_fast(x: &[f32], mut y: DisjointSlice<f32>) {
let i = thread::index_1d();
let k = i.get();
if let Some(v) = y.get_mut(i) {
*v = float::ex2_approx_ftz_f32(x[k] * LOG2_E);
}
}
/// Each thread sums a strided share of x; the block adds the 256 sums as a tree.
#[kernel]
#[launch_contract(domain = 1, block = (256, 1, 1))]
pub fn sum(x: &[f32], n: u32, mut block_sums: DisjointSlice<f32>) {
static mut S: SharedArray<f32, 256> = SharedArray::UNINIT;
let t = thread::threadIdx_x() as usize;
let block = thread::blockIdx_x() as usize;
let grid = thread::gridDim_x() as usize * 256;
let mut v = 0.0;
let mut i = block * 256 + t;
while i < n as usize {
v += x[i];
i += grid;
}
// SAFETY: each thread writes only its own cell, before the barrier.
unsafe { S[t] = v };
thread::sync_threads();
let mut step: usize = 0;
#[unroll]
while step < 8 {
let stride: usize = 128 >> step;
if t < stride {
// SAFETY: in this step thread t alone writes cell t, and it reads cell
// t + stride, which no thread writes in this step.
unsafe { S[t] += S[t + stride] };
}
thread::sync_threads();
step += 1;
}
if t == 0 {
// SAFETY: only thread 0 of each block writes, at its own block number.
unsafe { *block_sums.get_unchecked_mut(block) = S[0] };
}
}
}
/// The number of floats between a and b, for 2 floats of the same sign.
fn ulps(a: f32, b: f32) -> i64 {
    let ia = a.to_bits() as i32 as i64;
    let ib = b.to_bits() as i32 as i64;

    (ia - ib).abs()
}

/// The largest distance in ULPs between y and the nearest float to exp(x).
fn exp_error(x: &[f32], y: &[f32]) -> i64 {
    let mut worst = 0;

    for (&x, &y) in x.iter().zip(y) {
        let exact = (x as f64).exp() as f32;
        worst = worst.max(ulps(y, exact));
    }
    worst
}
/// 2 launches: 1,024 blocks write 1,024 partial sums, then 1 block adds them.
fn gpu_sum(
stream: &CudaStream,
module: &kernels::LoadedModule,
x: &DeviceBuffer<f32>,
n: u32,
partial: &mut DeviceBuffer<f32>,
total: &mut DeviceBuffer<f32>,
) -> Result<f32, Error> {
let many = module.prepare_sum(LaunchConfig1D::new(1024, 256, 0))?;
let one = module.prepare_sum(LaunchConfig1D::new(1, 256, 0))?;
module.sum(stream, &many, x, n, partial)?;
module.sum(stream, &one, partial, 1024, total)?;
Ok(total.to_host_vec(stream)?[0])
}
fn exp_test(stream: &CudaStream, module: &kernels::LoadedModule) -> Result<(), Error> {
let n = 1 << 20;
let point = |i: usize| -10.0 + 20.0 * i as f32 / n as f32;
let x: Vec<f32> = (0..n).map(point).collect();
let dx = DeviceBuffer::from_host(stream, &x)?;
let mut dy = DeviceBuffer::<f32>::zeroed(stream, n)?;
let blocks = n.div_ceil(256) as u32;
println!("y = exp(x) for 1,048,576 values of x in [-10, 10)");
let accurate = module.prepare_exp_accurate(LaunchConfig1D::new(blocks, 256, 0))?;
module.exp_accurate(stream, &accurate, &dx, &mut dy)?;
let y = dy.to_host_vec(stream)?;
let error = exp_error(&x, &y);
println!(" exp largest error {error:3} ULPs");
let fast = module.prepare_exp_fast(LaunchConfig1D::new(blocks, 256, 0))?;
module.exp_fast(stream, &fast, &dx, &mut dy)?;
let y = dy.to_host_vec(stream)?;
let error = exp_error(&x, &y);
println!(" ex2_approx largest error {error:3} ULPs");
Ok(())
}
fn verdict(error: f64, tolerance: f64) -> &'static str {
if error <= tolerance { "PASSED" } else { "FAILED" }
}
/// Sum x on the GPU twice: correctly, and as a caller passing 1 element too few.
fn sum_test(
stream: &CudaStream,
module: &kernels::LoadedModule,
title: &str,
x: &[f32],
tolerance: f64,
) -> Result<(), Error> {
let n = x.len() as u32;
let dx = DeviceBuffer::from_host(stream, x)?;
let mut partial = DeviceBuffer::<f32>::zeroed(stream, 1024)?;
let mut total = DeviceBuffer::<f32>::zeroed(stream, 1)?;
let exact: f64 = x.iter().map(|&v| v as f64).sum();
let good_sum = gpu_sum(stream, module, &dx, n, &mut partial, &mut total)?;
let bad_sum = gpu_sum(stream, module, &dx, n - 1, &mut partial, &mut total)?;
let good = (good_sum as f64 - exact).abs();
let bad = (bad_sum as f64 - exact).abs();
let good_verdict = verdict(good, tolerance);
let bad_verdict = verdict(bad, tolerance);
println!("{title}");
println!(" exact sum {exact:12.2}");
println!(" tolerance {tolerance:12.2}");
println!(" n elements error {good:6.2} {good_verdict}");
println!(" n - 1 elements error {bad:6.2} {bad_verdict}");
Ok(())
}
fn main() -> Result<(), Error> {
let ctx = CudaContext::new(0)?;
let stream = ctx.default_stream();
// SAFETY: the loaded code was compiled from the `kernels` module above.
let module = unsafe { kernels::load(&ctx)? };
exp_test(&stream, &module)?;
let n = 1 << 24;
let mut state: u32 = 1;
let mut magnitude = 0.0;
let mut random = Vec::with_capacity(n);
for _ in 0..n {
state = state.wrapping_mul(1_664_525).wrapping_add(1_013_904_223);
let v = (state >> 8) as f32 / 16_777_216.0;
magnitude += v as f64;
random.push(v);
}
// Each element passes through at most 84 additions on the way to the total:
// 64 + 8 in launch 1, 4 + 8 in launch 2. Each rounds by 2^-24 of its sum at most.
let bound = 84.0 * 2f64.powi(-24) * magnitude;
let title = "sum of 16,777,216 random floats in [0, 1)";
sum_test(&stream, &module, title, &random, bound)?;
// Partial sums of ones are whole numbers up to 2^24, which floats hold exactly.
let ones = vec![1.0f32; n];
sum_test(&stream, &module, "sum of 16,777,216 ones", &ones, 0.0)?;
Ok(())
}// Chapter 16: GPU results against the CPU, with a tolerance worked out in advance.
// Build: nvcc -arch=native verify.cu -o verify
#include <cmath>
#include <cstdint>
#include <cstdio>
#include <cstdlib>
#include <cstring>
#include <vector>
#include <cuda_runtime.h>
void check(cudaError_t err)
{
if (err != cudaSuccess) {
std::fprintf(stderr, "CUDA error: %s\n", cudaGetErrorString(err));
std::exit(1);
}
}
__global__ void expAccurate(const float* x, float* y, int n)
{
int i = blockIdx.x * blockDim.x + threadIdx.x;
if (i < n) {
y[i] = expf(x[i]);
}
}
__global__ void expFast(const float* x, float* y, int n)
{
int i = blockIdx.x * blockDim.x + threadIdx.x;
if (i < n) {
y[i] = __expf(x[i]);
}
}
// Each thread sums a strided share of x; the block adds the 256 sums as a tree.
__global__ void sum(const float* x, int n, float* blockSums)
{
__shared__ float s[256];
int t = threadIdx.x;
float v = 0.0f;
for (int i = blockIdx.x * 256 + t; i < n; i += gridDim.x * 256) {
v += x[i];
}
s[t] = v;
__syncthreads();
for (int stride = 128; stride > 0; stride /= 2) {
if (t < stride) {
s[t] += s[t + stride];
}
__syncthreads();
}
if (t == 0) {
blockSums[blockIdx.x] = s[0];
}
}
// The number of floats between a and b, for 2 floats of the same sign.
int64_t ulps(float a, float b)
{
    int32_t ia, ib;
    std::memcpy(&ia, &a, sizeof(float));
    std::memcpy(&ib, &b, sizeof(float));
    return std::llabs(int64_t(ia) - int64_t(ib));
}

// The largest distance in ULPs between y and the nearest float to exp(x).
int64_t expError(const std::vector<float>& x, const std::vector<float>& y)
{
    int64_t worst = 0;
    for (size_t i = 0; i < x.size(); ++i) {
        float exact = float(std::exp(double(x[i])));
        worst = std::max(worst, ulps(y[i], exact));
    }
    return worst;
}
// 2 launches: 1,024 blocks write 1,024 partial sums, then 1 block adds them.
float gpuSum(const float* dx, int n, float* partial)
{
sum<<<1024, 256>>>(dx, n, partial);
sum<<<1, 256>>>(partial, 1024, partial + 1024);
check(cudaGetLastError());
float total;
check(cudaMemcpy(&total, partial + 1024, sizeof(float), cudaMemcpyDeviceToHost));
return total;
}
void expTest()
{
const int n = 1 << 20;
std::vector<float> x(n), y(n);
for (int i = 0; i < n; ++i) {
x[i] = -10.0f + 20.0f * i / n;
}
float *dx, *dy;
check(cudaMalloc(&dx, n * sizeof(float)));
check(cudaMalloc(&dy, n * sizeof(float)));
check(cudaMemcpy(dx, x.data(), n * sizeof(float), cudaMemcpyHostToDevice));
int blocks = (n + 255) / 256;
std::printf("y = exp(x) for 1,048,576 values of x in [-10, 10)\n");
expAccurate<<<blocks, 256>>>(dx, dy, n);
check(cudaMemcpy(y.data(), dy, n * sizeof(float), cudaMemcpyDeviceToHost));
std::printf(" expf largest error %3lld ULPs\n", (long long)expError(x, y));
expFast<<<blocks, 256>>>(dx, dy, n);
check(cudaMemcpy(y.data(), dy, n * sizeof(float), cudaMemcpyDeviceToHost));
std::printf(" __expf largest error %3lld ULPs\n", (long long)expError(x, y));
check(cudaFree(dx));
check(cudaFree(dy));
}
const char* verdict(double error, double tolerance)
{
return error <= tolerance ? "PASSED" : "FAILED";
}
// Sum x on the GPU twice: correctly, and as a caller passing 1 element too few.
void sumTest(const char* title, const std::vector<float>& x, double tolerance)
{
    int n = x.size();
    float *dx, *partial;
    check(cudaMalloc(&dx, n * sizeof(float)));
    check(cudaMalloc(&partial, 1025 * sizeof(float)));
    check(cudaMemcpy(dx, x.data(), n * sizeof(float), cudaMemcpyHostToDevice));

    double exact = 0.0;
    for (float v : x) {
        exact += v;
    }

    double good = std::fabs(gpuSum(dx, n, partial) - exact);
    double bad = std::fabs(gpuSum(dx, n - 1, partial) - exact);

    std::printf("%s\n", title);
    std::printf("  exact sum       %12.2f\n", exact);
    std::printf("  tolerance       %12.2f\n", tolerance);
    std::printf("  n elements      error %6.2f  %s\n", good, verdict(good, tolerance));
    std::printf("  n - 1 elements  error %6.2f  %s\n", bad, verdict(bad, tolerance));

    check(cudaFree(dx));
    check(cudaFree(partial));
}

int main()
{
    expTest();

    const int n = 1 << 24;
    std::vector<float> random(n), ones(n, 1.0f);
    uint32_t state = 1;
    double magnitude = 0.0;
    for (float& v : random) {
        state = state * 1664525u + 1013904223u;
        v = (state >> 8) / 16777216.0f;
        magnitude += v;
    }

    // Each element passes through at most 84 additions on the way to the total:
    // 64 + 8 in launch 1, 4 + 8 in launch 2. Each rounds by 2^-24 of its sum at most.
    double bound = 84 * std::ldexp(1.0, -24) * magnitude;
    sumTest("sum of 16,777,216 random floats in [0, 1)", random, bound);

    // Partial sums of ones are whole numbers up to 2^24, which floats hold exactly.
    sumTest("sum of 16,777,216 ones", ones, 0.0);
    return 0;
}
Common mistakes
- Tuning a kernel before reading the timeline. In section 25.1.2, a kernel twice as fast saved 5.20 ms, while overlapping the copies saved 7.36 ms without changing the kernel.
- Trusting a clean exit. The out-of-bounds kernel produced correct output and exit status 0. The 2 barriers in 2 branches did the same on 1 GPU and hung another.
- Timing under a tool. memcheck made a load 217 times as slow, and the replay of
ncuchanges the caches between runs. Time kernels with events in an ordinary run. - Timing a cold kernel. The first run took 19.83 ms, and the warm runs 8.35 ms.
- Reporting the mean of a few runs. 4 outliers and 8 warm-up runs pulled the mean 1.11 ms above the median.
- Dividing by a computed peak. Each GPU reported 1 attribute that gives a wrong peak rate. Use the data sheet.
- A tolerance with no unit or no derivation. Count ULPs for single operations, derive the bound for sums, and add known-answer inputs with a tolerance of 0.
- Changing two things between measurements. The first fix of the Rust chase changed two things, and only a second measurement showed which one mattered.
- Profiling a debug build.
-Gturns off optimization. Profile the build that will run, built with-lineinfofor source lines.
Summary
- A trace records when each copy and kernel ran, and hardware counters record what happened inside a kernel. Nsight Systems reads the first and Nsight Compute the second, and the timeline comes first.
- The trace of Chapter 6’s pipeline accounted for the whole run: 0.66 ms + 10.61 ms + 0.90 ms of copies and kernels and 1.42 ms of gaps made up the 13.59 ms. The gaps came from the order of operations within a stream.
- A speed-of-light analysis can also be done by hand from the GPU’s limits and an event time.
y = 2 xused 63% of the GPU’s memory bandwidth and 0.33% of its arithmetic peak. - Compute Sanitizer found 4 bugs that printed no error: accesses to padding, a race between warps, 2 barriers in 2 branches, and a read of unwritten memory.
clock64()measured 4.24 cycles per dependent multiply-add, 39 cycles for a load from L1, 191 cycles from L2 and 598 to 1,137 cycles from DRAM, in C++ and in Rust.- Warm up, report medians, use events, use data larger than the L2 cache, check that the machine is idle, and verify the output.
- Count floating-point errors in ULPs, derive tolerances from error bounds, and add known-answer and property tests, which a tolerance cannot replace.
- Measure, form a hypothesis, change one thing, measure again, and verify.
In Chapter 26, we move from the single program to the GPU as a device in the whole system: how the CPU reaches the GPU’s registers, and how the GPU’s copy engines reach memory.
Exercises
- Account for the 1-stream run of Figure 25.2 in the way we accounted for the 2-stream run in section 25.2.2. What fraction of the run did each lane spend busy?
- Issue all 8 copies in of the 2-stream pipeline before any kernel, or use 3 streams, and trace the program again. Do the 3 gaps of 0.47 ms disappear? Account for the new total.
- Profile
sgemmof Chapter 9 withncuon a machine where you can read counters. Compare theSpeedOfLightpercentages with Figure 25.3, and find how much of the patch kernel’s 8 GiB of loads came from DRAM. - Change
bugs.cuto use 1,010 elements. Which elements of which array does the unguarded kernel now overwrite? Predict the answer, then check it with memcheck. - Put the 2 barriers of Listing 25.5 into a block of 64 threads in which the 2 branches fall in
different warps (for example,
t < 32). Does synccheck still report an error? Explain. Run the program under synccheck first, because the plain program may hang, as it did on the first GPU. - Extend
latency.cuwith a chain of 16 MiB. Where does its latency fall between the L2 and DRAM figures on a GPU with a 2 MiB L2 cache, and on one with a 40 MiB L2 cache? - Run
measuretwice in a row, then again after 5 minutes of idle time. Compare the first 10 runs of each, and explain the difference. - Derive the tolerance of
verify.cu’s sum for 226 elements. Then construct an input with a known exact sum other than all ones, and use it to detect the \(n - 1\) bug. - Compile
verify.cuwith--use_fast_math. Which line of its output changes, and why?
Sources and further reading
- NVIDIA, Nsight Systems User Guide: https://docs.nvidia.com/nsight-systems/UserGuide/
- NVIDIA, Nsight Compute Profiling Guide, “Metrics Structure”, “Replay” and the sections
SpeedOfLight,OccupancyandWarpStateStats: https://docs.nvidia.com/nsight-compute/ - NVIDIA, Compute Sanitizer User Manual: https://docs.nvidia.com/compute-sanitizer/
- NVIDIA, CUDA-GDB: https://docs.nvidia.com/cuda/cuda-gdb/
- NVIDIA, “ERR_NVGPUCTRPERM: Permission issue with Performance Counters”: https://developer.nvidia.com/ERR_NVGPUCTRPERM
- H. Naghibijouybari, A. Neupane, Z. Qian and N. Abu-Ghazaleh, “Rendered Insecure: GPU Side Channel Attacks are Practical”, ACM CCS 2018: the attack behind CVE-2018-6260.
- NVIDIA, CUDA C++ Programming Guide, “Mathematical Functions” (error bounds of
expfand__expf) and “Synchronization Functions”: https://docs.nvidia.com/cuda/cuda-c-programming-guide/ - D. Goldberg, “What Every Computer Scientist Should Know About Floating-Point Arithmetic”, ACM Computing Surveys 23(1), 1991.
- N. J. Higham, Accuracy and Stability of Numerical Algorithms, 2nd ed., SIAM, 2002, chapter 4 (summation).
- H. Wong et al., “Demystifying GPU Microarchitecture through Microbenchmarking”, ISPASS 2010:
pointer chases and
clock()on a GPU.